Weather's Hidden Influence on Outdoor Competition Results: Data Patterns for Informed Decisions
Ulrich Hayes · Aug 16, 2026

Weather's Hidden Influence on Outdoor Competition Results: Data Patterns for Informed Decisions
Weather conditions shape outcomes across outdoor competitions in measurable ways, and researchers have tracked these effects through decades of performance records from events like marathons, tennis tournaments, golf majors, and baseball seasons. Temperature swings, wind speeds, humidity levels, and precipitation patterns alter physical demands on athletes, which in turn produces consistent statistical shifts in results that analysts now use to refine training schedules and event planning.
Temperature Thresholds and Endurance Metrics
Studies from multiple regions show that air temperatures above 25 degrees Celsius slow marathon finishing times by an average of 2 to 5 percent compared with cooler conditions around 10 to 15 degrees, because core body heat rises faster and forces athletes to reduce pace to avoid overheating. Data collected from major races in Europe and North America between 2010 and 2025 confirm this pattern holds across elite and recreational fields alike, while August 2026 forecasts for several European marathons already flag similar temperature ranges that organizers monitor for start-time adjustments.
Cycling time trials reveal comparable effects, where sustained efforts in heat above 30 degrees Celsius increase power output variability and reduce overall speeds, according to records maintained by international federations. Those who analyze these datasets note that recovery intervals between stages also lengthen under high humidity, creating cumulative fatigue that appears in stage-race classifications.
Wind Patterns and Precision Sports
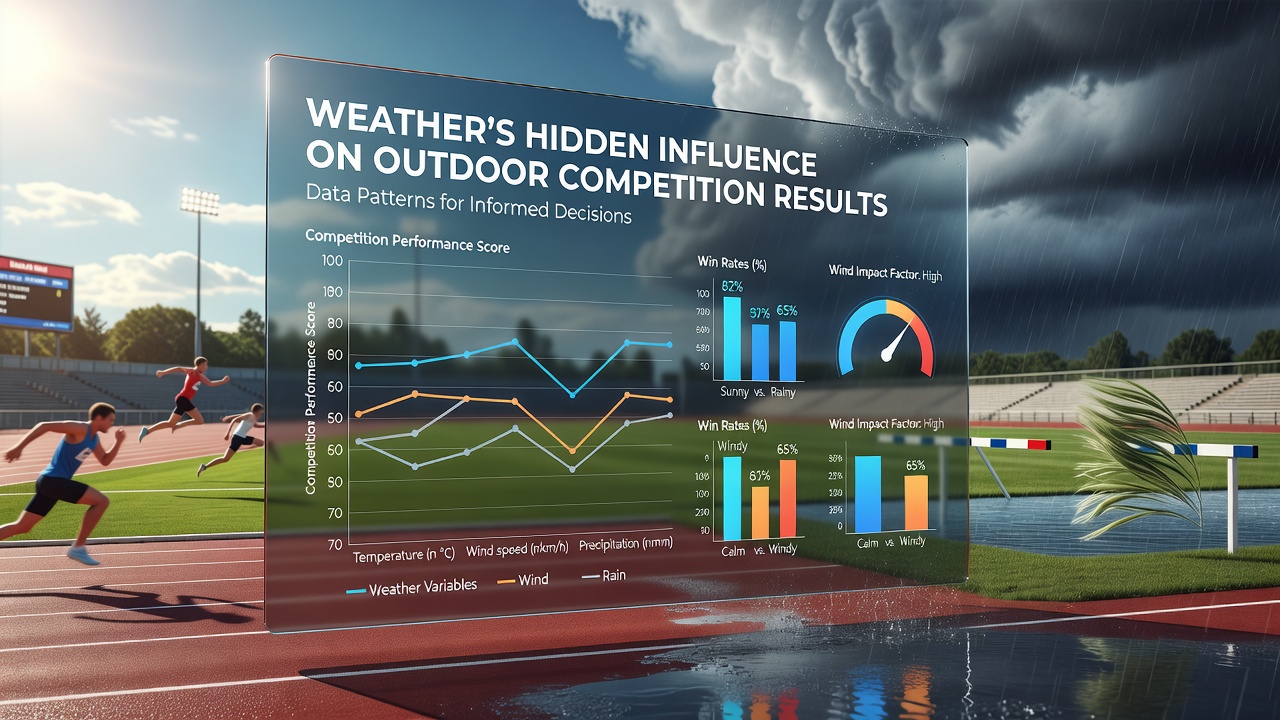
Crosswinds exceeding 15 kilometers per hour disrupt serve percentages in professional tennis by measurable margins, with studies from Australian and American tournaments indicating a 4 to 7 percent drop in first-serve accuracy when gusts exceed that threshold. Golf data from the PGA Tour similarly records increased scoring averages on exposed courses during windy rounds, particularly on par-3 holes where club selection becomes less predictable.
Baseball statistics compiled over multiple seasons demonstrate that wind blowing out at speeds above 10 kilometers per hour correlates with higher home-run totals at certain stadiums, whereas incoming winds suppress fly-ball distances and shift defensive positioning strategies. Observers tracking these variables across different ballparks find that teams adjust lineup decisions and bullpen usage based on morning weather briefings.
Precipitation Effects on Surface and Visibility
Rainfall alters playing surfaces in ways that change game dynamics, and records from cricket matches in the UK and Australia show reduced run rates during wet periods because bowlers gain additional swing while batters face lower visibility. Track and field events experience parallel shifts, with long-jump and pole-vault distances declining after rainfall because takeoff surfaces lose grip and athletes shorten their approaches.
Baseball games played in light rain produce higher error rates on grass infields, according to league-wide defensive metrics, while heavier downpours trigger delays that compress pitching rotations and increase bullpen usage in subsequent games. Analysts examining these sequences identify recurring patterns where teams with deeper pitching staffs maintain better win percentages after weather-related postponements.
Integrating Meteorological Data into Decision Frameworks
Event organizers and coaching staffs now incorporate forecasts from agencies such as NOAA and the Australian Bureau of Meteorology to set start times, adjust equipment rules, and modify hydration protocols. Performance databases maintained by universities in Canada and the Netherlands allow direct comparison of historical results against archived weather readings, revealing that certain athlete profiles adapt faster to temperature changes than others.
August 2026 competitions in the southern hemisphere already face early spring variability that meteorologists link to shifting jet-stream positions, prompting federations to issue updated guidelines on heat-acclimatization periods. Those who review multi-year datasets observe that teams and individuals who align preparation cycles with expected conditions record steadier results across seasons.
Conclusion
Weather variables generate predictable statistical signatures across outdoor competitions, and organizations that systematically match performance records with meteorological archives gain clearer pictures of how temperature, wind, and precipitation shift outcomes. Continued collection of granular data supports more precise scheduling and preparation adjustments that reflect real environmental influences rather than averages alone.