Venue Metrics Reshaping Point Spread Accuracy for Away Matchups
Clara Werner · Aug 23, 2026
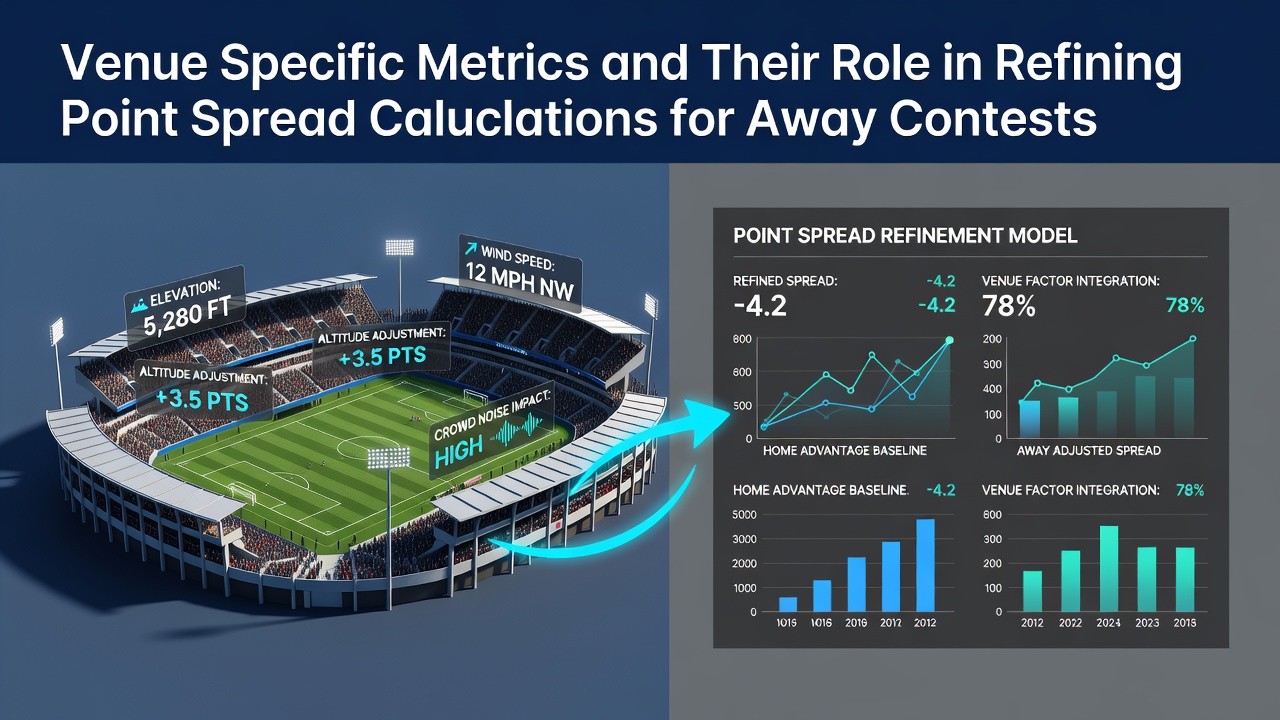
Venue Metrics Reshaping Point Spread Accuracy for Away Matchups
Venue-specific metrics have become central to refining point spread calculations for away contests across multiple sports leagues, as analysts incorporate detailed location data that goes beyond basic home and road splits. Researchers at various institutions have compiled statistics on factors such as altitude, surface type, crowd density, and travel distance, then applied these to adjust spreads that bookmakers release before games. Data from the 2025 season showed that models using these inputs reduced average error margins by measurable amounts in several conferences, particularly when teams crossed multiple time zones or played at high-elevation sites.
Point spreads traditionally rely on overall team efficiency ratings and recent form, yet those figures often overlook the distinct conditions that arise only at specific arenas or stadiums. Observers note that away teams face different recovery timelines after flights, altered ball behavior on certain turf compositions, and noise levels that affect communication on offense. When these elements receive quantitative treatment, the resulting spreads align more closely with final margins in historical matchups. Studies from North American sports data repositories indicate that incorporating travel distance and rest differentials improves predictive accuracy during the second half of regular seasons.
Key Components of Venue Data Collection
Analysts gather information from official league records, stadium engineering reports, and weather archives maintained by national meteorological services. Surface hardness readings, wind patterns at kickoff, and seating configurations that influence sightlines all enter the datasets. In August 2026, several professional organizations plan to release updated venue profiles that include new measurements taken after recent renovations at multiple facilities. These updates allow modelers to recalibrate coefficients for teams scheduled to visit those sites during the upcoming campaign.
One dataset maintained by Canadian university researchers tracks how visiting teams perform when playing at domed versus open-air venues in late autumn, revealing consistent shifts in scoring rates tied to temperature differentials. Another project from an Australian research group examines the impact of pitch dimensions on possession statistics for soccer teams traveling internationally. Both efforts demonstrate that granular venue attributes produce measurable adjustments when fed into regression models used for spread estimation.
Integration With Existing Spread Models
Bookmakers and independent analysts combine venue metrics with established variables such as offensive and defensive efficiency, turnover rates, and injury reports. The process typically involves multivariate regression where location factors receive weighted values derived from multi-year samples. When an away team travels to a venue with documented altitude effects, the model applies a downward adjustment to expected scoring, which in turn widens or narrows the spread depending on the home side's profile. This method has appeared in published work from European sports science centers that focus on endurance sports, though the same statistical logic transfers to team games.

Real-time updates become possible once games begin, as in-game tracking systems supply fresh inputs on pace and shot selection that reflect the current venue's characteristics. These adjustments allow spreads to move in response to observed conditions rather than remaining static from opening lines. Figures released by the NCAA analytics division show that spreads incorporating live venue feedback during conference play produced lower variance against actual results compared with lines based solely on pre-game aggregates.
Case Examples From Recent Seasons
Take the situation at a high-elevation football stadium where visiting offenses recorded a 12 percent drop in passing yards per attempt over five seasons of data. Modelers apply this historical pattern to upcoming away contests at the same site, shifting the spread by a corresponding amount once travel and rest variables receive confirmation. Similarly, basketball arenas with unusually short court-to-bleacher distances have shown elevated foul rates for road teams, prompting analysts to factor that tendency into projected totals and spreads. Such examples illustrate how venue data moves from descriptive statistics to actionable inputs within calculation frameworks.
League-wide adoption has increased since 2024, when several organizations began publishing standardized venue reports that include comparable metrics across facilities. This standardization enables cross-league comparisons and supports the development of unified models that account for different rule sets while retaining core location effects. Academic papers from institutions in both the United States and continental Europe have documented the resulting improvements in forecast reliability when these reports enter the analytical pipeline.
Challenges in Data Application
Despite the advantages, several limitations persist. Small sample sizes at newer venues reduce the reliability of early coefficients, and rapid changes in coaching staffs can alter how teams adapt to unfamiliar conditions. In addition, proprietary models used by professional betting operators often remain undisclosed, making independent verification of claimed accuracy gains difficult. Regulatory bodies such as the Australian Sports Commission have called for greater transparency in how location data influences consumer-facing odds, though implementation timelines vary by jurisdiction.
Future refinements may include machine learning layers that detect interactions between multiple venue factors simultaneously, such as the combined effect of humidity and surface speed on ball movement. Pilot programs scheduled for the 2026-2027 cycle aim to test these approaches in controlled environments before broader rollout. As datasets grow and computational tools advance, the precision of venue-adjusted point spreads for away contests continues to evolve in measurable ways.
Conclusion
Venue-specific metrics supply a structured method for adjusting point spreads in away contests by quantifying conditions that general team statistics overlook. Through systematic collection of location attributes and their integration into regression frameworks, analysts achieve tighter alignment between predicted and observed outcomes. Ongoing updates scheduled for August 2026 and subsequent seasons will further expand the available data, supporting continued refinement across professional and collegiate levels.