Seasonal Patterns and Their Impact on Racing Circuits and Team Leagues
Eden Friedrich · Jun 24, 2026
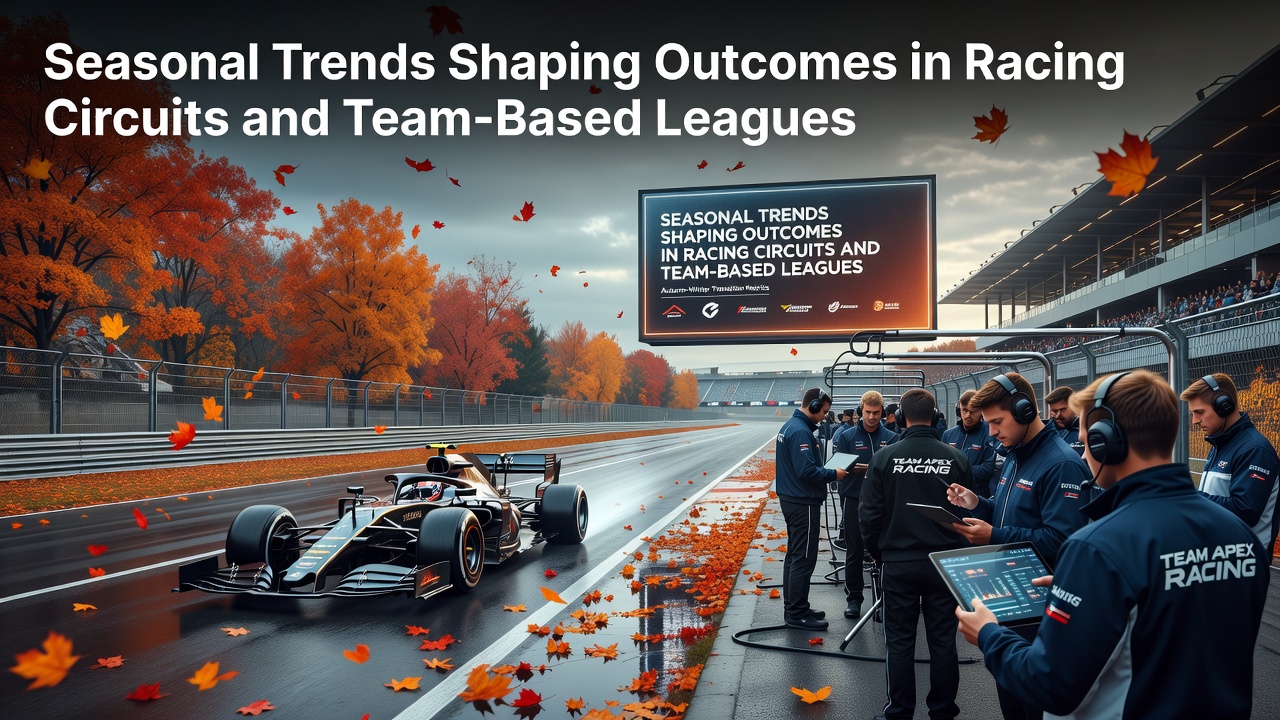
Seasonal Patterns and Their Impact on Racing Circuits and Team Leagues
Seasonal shifts bring measurable changes to performance metrics across motorsports circuits and organized team competitions, according to data compiled by governing bodies and league statisticians. Weather variations, daylight duration, and fixture congestion create consistent patterns that teams and drivers adapt to each year.
Weather and Track Conditions in Motorsports
Racing series such as Formula 1 and NASCAR encounter distinct environmental factors tied to calendar months. Summer events often feature higher ambient temperatures that increase tire degradation rates while altering engine cooling requirements, data from the Fédération Internationale de l'Automobile shows. Winter testing sessions in regions like the Middle East produce different grip levels compared with European rounds held in spring or autumn, when rainfall probabilities rise sharply.
June 2026 aligns with the midpoint of several international calendars, placing events in Canada and Spain during transitional weather windows where sudden temperature drops between sessions have historically influenced qualifying order. Observers note that teams monitor barometric pressure trends weeks in advance because these readings correlate with downforce adjustments on high-speed circuits.
Fixture Density and Player Availability in Team Leagues
Team-based leagues experience their own seasonal rhythms driven by travel demands and recovery windows. European football divisions schedule the majority of matches between August and May, creating compressed periods after international breaks when injury reports spike according to records maintained by the Union of European Football Associations. North American basketball and hockey leagues extend deeper into June, overlapping with warmer months that affect indoor arena conditions and player hydration strategies.
Research compiled by the Australian Institute of Sport indicates that teams traveling across multiple time zones during late-season blocks record measurable declines in shooting accuracy and defensive reaction times. These statistics become especially relevant when June fixtures coincide with national team windows or playoff qualification races.

Coaches adjust training loads accordingly, yet residual fatigue from earlier months continues to appear in match logs published by major leagues.
Equipment and Regulatory Adjustments
Technical regulations respond to seasonal realities as well. Tire suppliers for grand prix racing introduce compound selections calibrated for expected track temperatures, a practice documented in official technical bulletins released before each event. Similarly, basketball leagues enforce uniform hydration protocols during summer exhibition tours where heat indices climb above typical indoor thresholds.
Those who track multi-year datasets observe that aerodynamic setups optimized for cooler spring races often require recalibration once ambient heat rises, producing shifts in lap-time distributions that appear across telemetry archives.
Long-Term Scheduling Trends
League calendars evolve gradually to balance commercial interests with competitive equity. Expansion of evening kickoffs during winter months in northern hemisphere competitions stems from television scheduling priorities yet simultaneously reduces exposure to low-light conditions that once affected referee decision accuracy. In southern hemisphere cricket and rugby seasons, the alignment of monsoon periods wth specific tournament phases prompts venue rotations that alter home-advantage statistics tracked by national federations.
June 2026 will see several circuits host twilight races timed to avoid peak solar radiation, a scheduling choice reflected in updated safety car deployment logs from prior comparable events.
Conclusion
Consistent patterns emerge when performance indicators are examined across multiple seasons in both racing circuits and team leagues. Temperature ranges, fixture congestion, and regulatory adaptations combine to shape outcomes in predictable ways that statistical agencies continue to quantify for future planning cycles.