Rugby’s Annual Rhythm Shapes International Performance and Multi-Market Dynamics
Theo Powell · Aug 21, 2026

Rugby’s Annual Rhythm Shapes International Performance and Multi-Market Dynamics
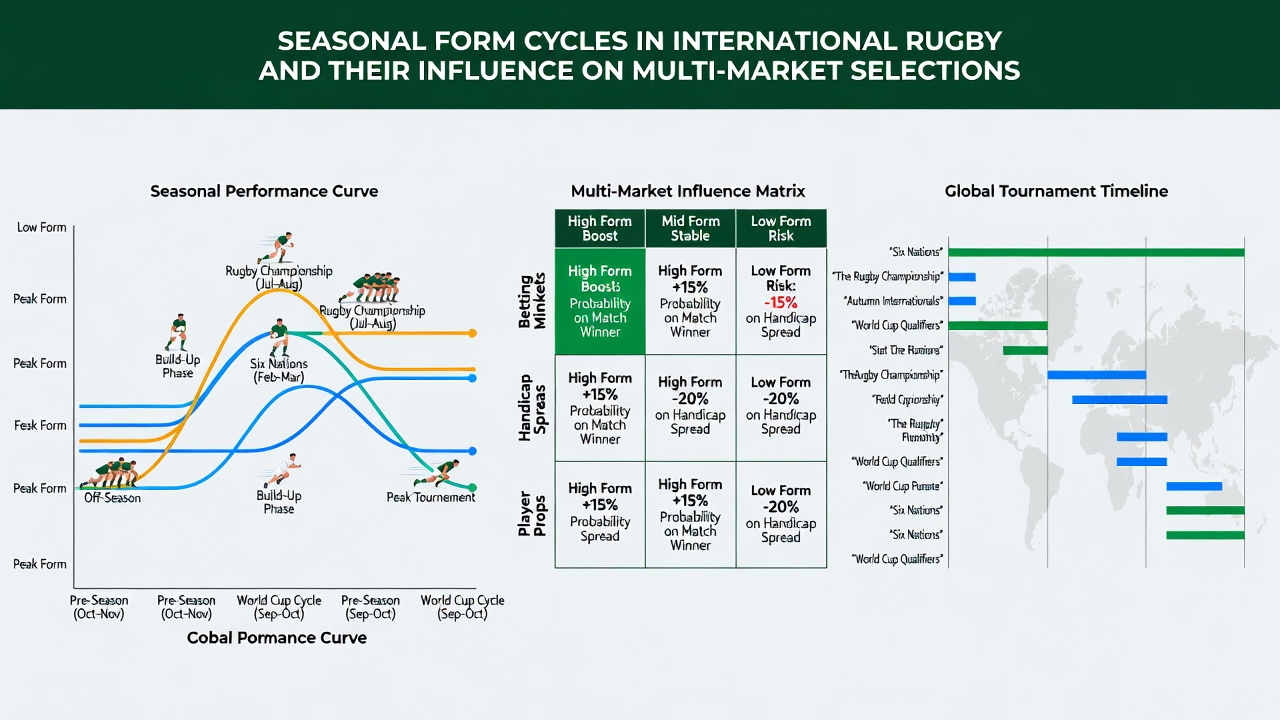
International rugby follows distinct seasonal patterns that emerge from the calendar of major competitions, player rest periods, and travel demands across hemispheres. Northern hemisphere teams typically peak during the Six Nations period from February through March, while southern hemisphere squads often reach higher levels during the Rugby Championship window that begins in July and extends into August. These cycles create measurable shifts in team output that influence several betting markets simultaneously, including match winner selections, handicap lines, total points, and player performance props. Observers note that data from World Rugby shows consistent variations in scoring rates and win percentages tied to the time of year and fixture density.
Understanding Form Cycles Across Hemispheres
Form cycles develop because teams alternate between club commitments and national duties, with recovery windows that differ by region. European sides often experience a post-Six Nations dip when domestic leagues resume, whereas teams from Australia, New Zealand, and South Africa adjust to longer-haul travel during the southern winter. Research from the New Zealand Rugby Union indicates that win rates for All Blacks sides drop by roughly 8 percent in the immediate aftermath of major tours, while forward packs record lower tackle completion percentages during August windows when player rotation increases. These patterns extend beyond single matches and affect multi-market selections where bettors combine outcomes across several games in a round.
Key Markets Affected by Seasonal Shifts
Multi-market selections gain complexity when seasonal form enters the equation. Handicap markets widen during periods of high fixture congestion because teams rest key players, leading to larger margins in some contests and tighter contests in others. Total points markets also respond to weather patterns that coincide with specific months, such as wet conditions in the United Kingdom during February that reduce try counts. Player performance props tied to meters gained or lineout success show measurable changes when squads introduce less experienced personnel during August tours. Data compiled by the Australian Sports Commission reveals that lineout accuracy for southern hemisphere sides improves by an average of 6 percent when matches occur outside their domestic season, altering prop and hooker selections in combined bets.
Travel, Recovery, and Performance Data
Long-haul travel between hemispheres compounds fatigue during certain calendar windows. Teams crossing time zones for July or August tests often show reduced high-speed running metrics in the opening 20 minutes of matches. Studies published by the University of Cape Town’s Exercise Science department tracked GPS data from Super Rugby and international fixtures, finding that recovery time between games influences both defensive error rates and penalty counts. These statistics feed directly into markets that combine team totals with individual player milestones. When August 2026 approaches, several nations will face compressed schedules that include preparatory matches ahead of the next Rugby World Cup cycle, increasing the likelihood that rotation patterns will again alter expected outcomes across multiple markets.
Case Examples from Recent Cycles
One notable pattern emerged during the 2023 Rugby Championship when New Zealand recorded lower average possession percentages in away fixtures played in August compared with earlier July tests. Similar trends appeared in European sides returning from southern tours, where first-half points totals declined in the subsequent November internationals. These examples illustrate how form cycles influence not only outright results but also the timing of scoring and the distribution of points between halves, factors that matter when constructing multi-market combinations.
Statistical Sources and Tracking Methods
Comprehensive datasets now allow deeper examination of these cycles. World Rugby publishes annual performance reports that break down metrics by month and competition, while national unions maintain internal tracking systems that feed into public summaries. Academic researchers have cross-referenced these figures with travel and weather records to isolate seasonal effects from other variables. Such sources provide objective baselines that clarify how August fixtures, for instance, differ from February or October windows in both volume and style of play.
Conclusion
Seasonal form cycles in international rugby arise from the interplay of competition calendars, travel demands, and recovery protocols. These recurring patterns produce measurable effects on team statistics that extend across several betting markets at once. As schedules evolve toward August 2026 and beyond, continued monitoring of performance data will remain essential for understanding how form variations translate into outcomes across match winner, handicap, and player-specific selections.