Public Betting Data as a Window into League Market Dynamics
Clara Hughes · Jul 12, 2026
Public Betting Data as a Window into League Market Dynamics
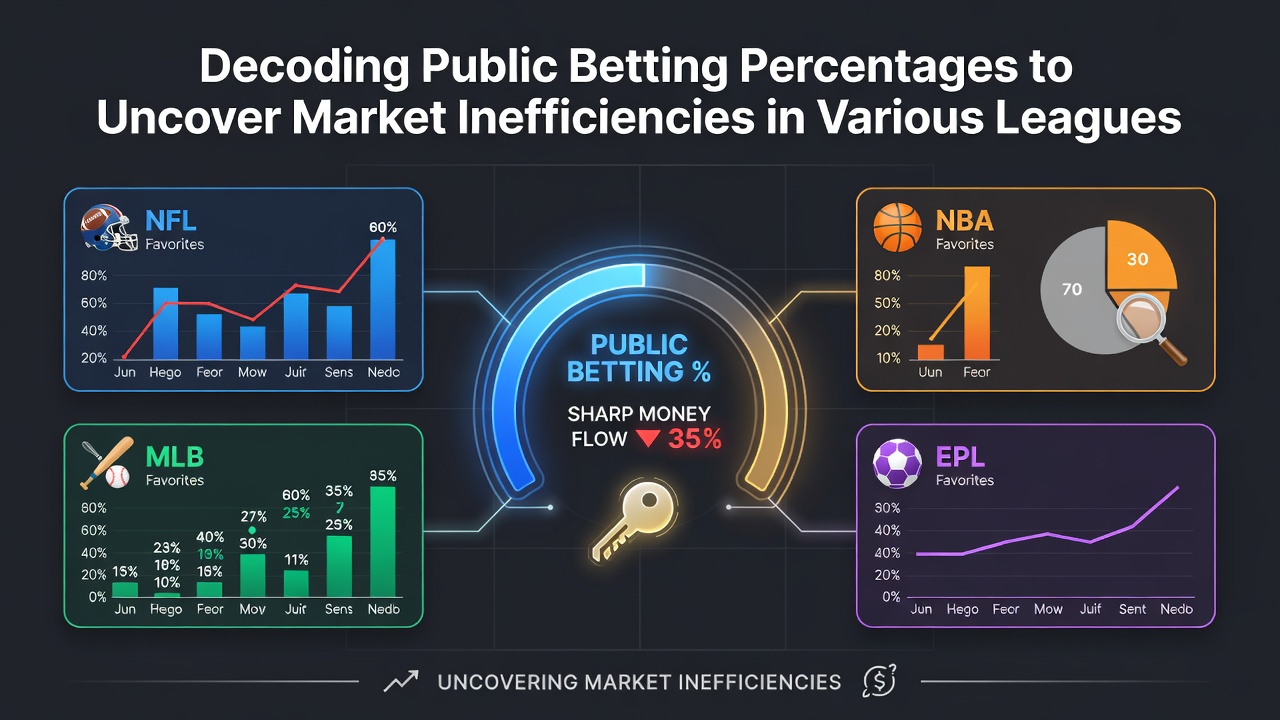
Public betting percentages represent the proportion of wagers placed on each side of a matchup, and analysts track these figures closely because they often diverge from the actual probability implied by odds. When a large majority of bets lands on one outcome, the line may move in response to that volume, yet the underlying value can shift toward the opposite side if professional money remains light. Observers note that this dynamic appears consistently across football, basketball, baseball, and hockey leagues, where differing bettor behaviors create measurable gaps between public sentiment and market efficiency.
How Percentages Translate into Market Signals
Betting exchanges and sportsbooks publish these percentages in real time, allowing anyone to compare ticket distribution against the closing line. Data shows that lines frequently adjust more aggressively when public money concentrates heavily on favorites, which can inflate the price beyond its true probability. Researchers at institutions studying gambling behavior have documented cases where a 75 percent public split on one side correlates with a measurable edge on the underdog once the line stabilizes. Because sportsbooks balance risk through limits and adjustments, heavy public action on one outcome sometimes leaves the opposing side priced at better value than its actual chance of winning would suggest.
League differences matter because bettor demographics vary. In European football competitions, casual supporters often favor high-profile clubs regardless of form, producing lopsided percentages that sharp operators exploit. In North American basketball and football, local team loyalty and media narratives drive similar imbalances, particularly during playoff periods when emotional betting spikes. Figures released by the Nevada Gaming Control Board illustrate how these patterns shift across seasons, with public percentages deviating most during high-attention events.
Patterns Across Football, Basketball, and Baseball
Premier League matches frequently display public percentages exceeding 70 percent on home favorites, especially when popular clubs host mid-table sides. Records indicate that such lopsided action often pushes the line higher than statistical models support, creating situations where the away side or draw becomes the more efficient selection. In contrast, NBA regular-season games show more balanced percentages during weekday matchups, yet percentages swing sharply toward star players' teams on nationally televised nights. Major League Baseball exhibits its own rhythm, with public money heavily favoring aces on the mound while underdog pitchers receive lighter support even when advanced metrics suggest competitiveness.
One study released by the European Gaming and Betting Association examined thousands of fixtures and found that markets with public splits above 65 percent on a single outcome produced statistically significant inefficiencies in roughly one-third of cases. The same report noted that leagues with greater media coverage tended to amplify these distortions because casual bettors react more strongly to headlines than to underlying statistics.
Detecting Inefficiencies Through Percentage Analysis
Analysts compare public percentages against historical closing-line value to isolate opportunities. When public support reaches extreme levels yet the line does not move proportionally, sharp money may already be positioned on the opposite side. This mismatch appears most clearly in leagues where betting volume is moderate rather than overwhelming, allowing smaller sharp bets to influence pricing before public action arrives. Data from multiple jurisdictions reveals that inefficiencies cluster around mid-week fixtures and games involving teams with recent roster changes, periods when public bettors rely more on outdated narratives.
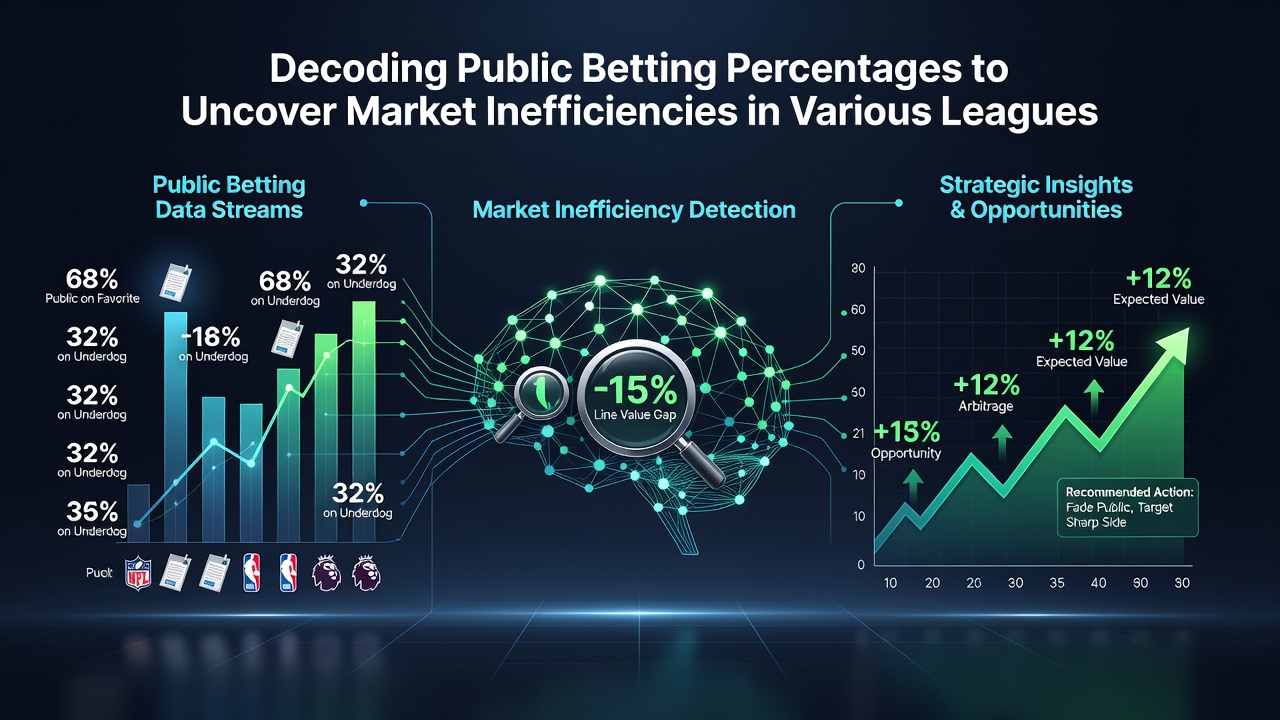
July 2026 offers a useful window for reviewing these patterns because off-season roster updates and international tournaments alter team strengths before new campaigns begin. Observers tracking early lines for the following season note that public percentages often lag behind revised statistical projections during this transitional phase, producing temporary inefficiencies that close once regular-season betting volume increases. Tracking tools that aggregate percentages across bookmakers help identify these windows by highlighting spreads that remain static despite growing public interest.
League-Specific Considerations and Data Sources
Each competition carries distinct characteristics that influence how percentages translate into value. Australian football leagues demonstrate pronounced home bias in public betting, while Canadian hockey markets show stronger support for teams with recent playoff success. These regional tendencies mean that cross-league comparisons require adjustments for local betting cultures and regulatory environments. Government reports from bodies such as the Australian Communications and Media Authority have catalogued how promotional activity and media coverage interact with public percentage spikes, providing additional context for interpreting raw numbers.
Practical application involves monitoring percentages at multiple intervals rather than relying on a single snapshot. Early percentages often reflect recreational bettors who place wagers days ahead, whereas late percentages incorporate sharper action that arrives closer to game time. When early and late figures diverge significantly, the market may be absorbing information unevenly, which can signal remaining inefficiencies until the line settles.
Conclusion
Public betting percentages function as observable indicators within sports markets, revealing where collective sentiment diverges from pricing efficiency across football, basketball, baseball, and hockey competitions. Systematic tracking of these figures, combined with league-specific context and timing analysis, supplies factual data points that participants use to evaluate potential value. As betting infrastructure continues to evolve through 2026 and beyond, the same principles of percentage interpretation remain applicable across different regulatory regions and competition formats.