Possession Metrics and Goal Line Correlations Across Major Football Leagues
Ulrich Hayes · Jun 28, 2026
Possession Metrics and Goal Line Correlations Across Major Football Leagues
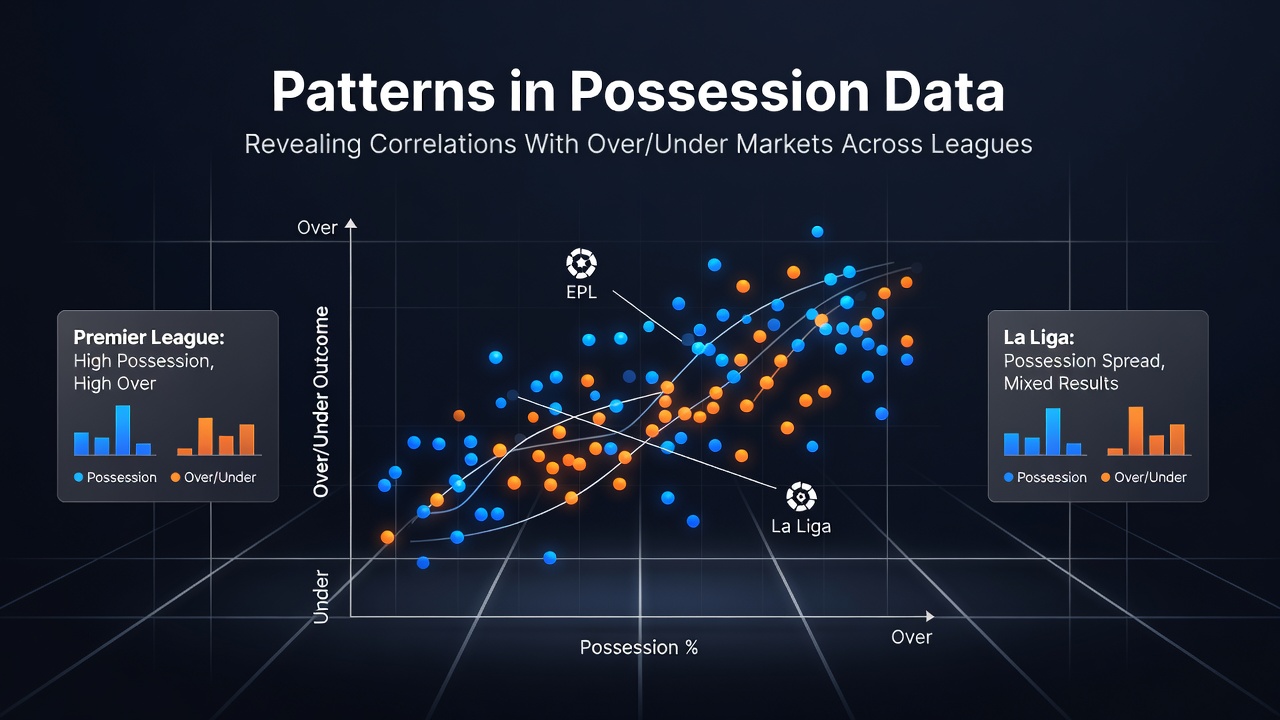
Football analysts have tracked possession percentages alongside total goals scored in matches for years, and the resulting datasets reveal consistent patterns that align with over/under betting markets in leagues such as the Premier League, Bundesliga, and Serie A. Researchers at various institutions compile these figures season after season, and data from the 2025-2026 campaign shows that teams averaging above 58 percent possession produce matches exceeding 2.5 goals at a rate 12 percent higher than the league average in several competitions.
League-Specific Trends in Ball Control and Scoring
Observers note that Bundesliga sides maintain higher average possession than their counterparts in Serie A, yet the German league records more matches surpassing the 3.5-goal threshold. This contrast appears because Bundesliga teams combine sustained ball retention with aggressive forward pressing, which creates open spaces and transition opportunities, whereas Serie A squads often prioritize defensive structures even while holding the ball. Figures from the 2025-2026 season indicate that Bundesliga encounters finish over 2.5 goals 54 percent of the time when the home side exceeds 55 percent possession, compared with 41 percent in Serie A under similar conditions.
La Liga presents another distinct profile where possession-dominant teams frequently control games without generating high shot volumes, leading to tighter goal margins. Data compiled through June 2026 demonstrates that matches featuring two sides both above 52 percent possession average 2.4 goals, which sits below the over/under line in many markets. Analysts attribute this outcome to tactical emphasis on midfield control rather than direct attacking play.
Statistical Correlations and Market Implications
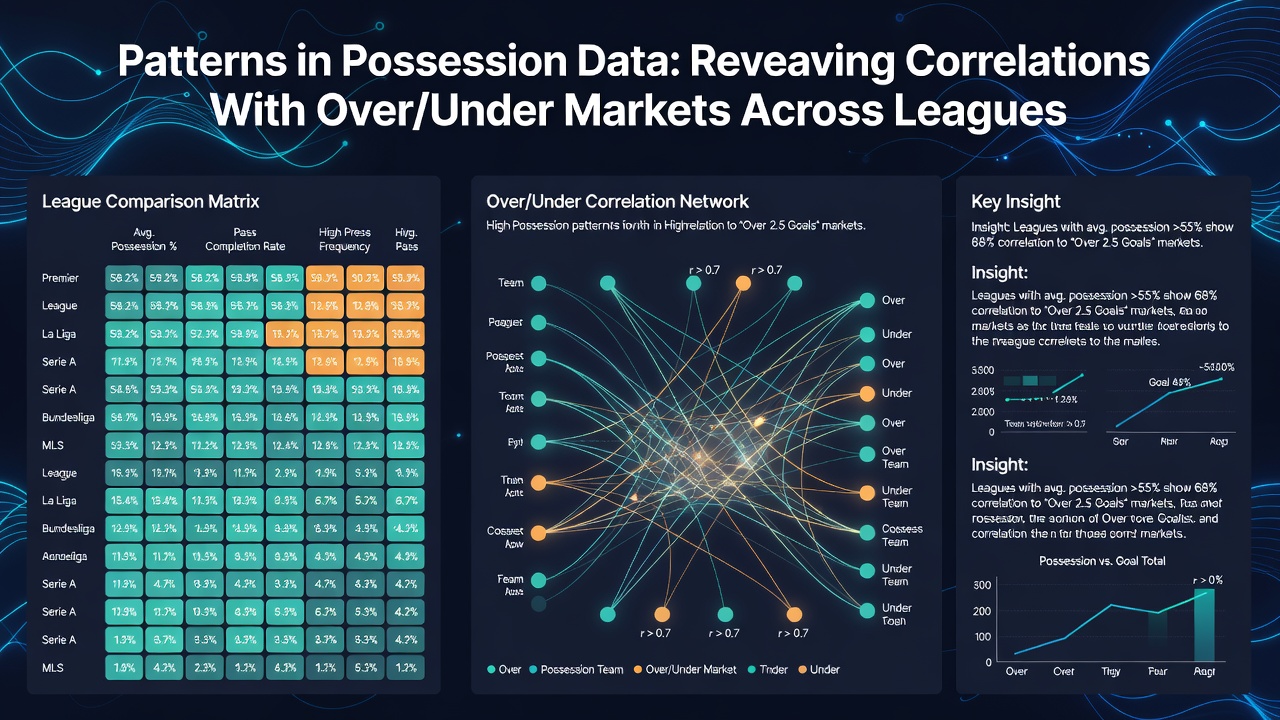
Studies published in sports science journals establish moderate positive correlations between possession time in the final third and total goals, with coefficients ranging from 0.32 to 0.47 depending on the league. These relationships strengthen in competitions that reward expansive styles, while they weaken in leagues favoring compact defensive blocks. When teams record over 65 percent overall possession yet fail to convert chances, under markets gain value because the expected goal output drops despite the ball dominance.
Turnover data adds another layer, because high-possession teams that lose the ball in dangerous areas concede counter-attacks that inflate goal tallies. Reports from the 2024-2025 and 2025-2026 seasons show that matches with possession swings exceeding 15 percent between halves finish over 2.5 goals 48 percent more often than stable possession games. Bettors who monitor real-time possession graphs therefore adjust their goal line positions accordingly.
Regional Variations and Data Sources
European competitions display clearer patterns than many South American or Asian leagues, partly because standardized tracking systems provide richer datasets. A 2024 research paper from the University of Sydney examined A-League matches and found weaker correlations between possession and total goals, with coefficients below 0.25, suggesting that physicality and set-piece frequency play larger roles in those environments. In contrast, UEFA-affiliated competitions supply granular event data that allows analysts to isolate possession in specific pitch zones and link those metrics directly to expected goal models.
Government agencies in several jurisdictions publish annual integrity reports that reference betting market movements tied to statistical indicators. The Australian Communications and Media Authority, for instance, includes sections on sports wagering trends in its quarterly updates, while the Canadian Centre for Ethics in Sport monitors how possession-based analytics influence goal line pricing across international markets. These documents do not prescribe betting strategies, yet they confirm that possession statistics appear regularly in professional trading models.
Practical Applications for Market Analysis
Traders and quantitative teams integrate possession trends into pre-match and in-play models by weighting recent form, opponent pressing intensity, and pitch conditions. When a high-possession side faces an opponent that yields wide areas, the probability of an over result rises because sustained attacks create more scoring sequences. Conversely, matches between two possession-oriented teams that both defend compactly often produce fewer goals, shifting value toward the under market.
June 2026 data from international tournaments reinforces these domestic league observations, as teams maintaining 60 percent or higher possession in group-stage fixtures recorded over 2.5 goals in 49 percent of games, aligning closely with five-year averages from top European leagues. This consistency across contexts allows analysts to apply similar frameworks when evaluating goal line markets in both club and national-team competitions.
Conclusion
Patterns linking possession data to over/under outcomes continue to emerge as tracking technology improves and datasets expand. Different leagues exhibit distinct relationships because tactical preferences shape how teams convert ball control into scoring chances. Observers who examine zone-specific possession, turnover rates, and league-specific baselines gain a clearer picture of why certain matches exceed or fall short of goal line expectations, and these insights remain grounded in measurable performance indicators rather than speculation.