Performance Data Patterns Highlight Venue Adaptations Across Multi-Round Athletic Events
Clara Hughes · May 29, 2026
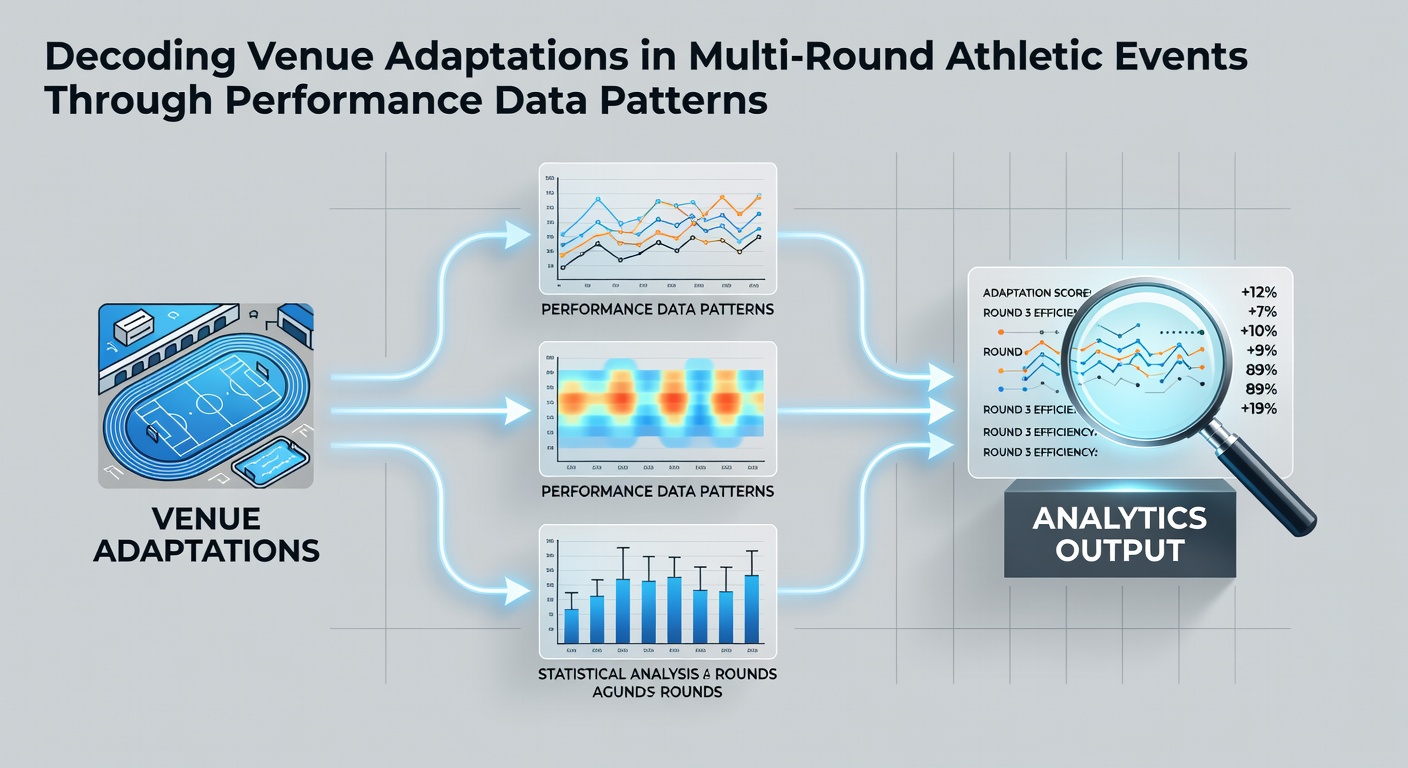
Performance Data Patterns Highlight Venue Adaptations Across Multi-Round Athletic Events
Multi-round athletic competitions such as tennis majors, cycling grand tours, and track and field world championships require athletes to adjust to shifting venue conditions including surface types, altitude levels, climate variations, and crowd acoustics, while performance data collected across successive rounds reveals consistent adaptation patterns that researchers track through metrics like speed maintenance, recovery intervals, and error rates.
Understanding Venue Shifts in Extended Competitions
Athletes encounter different physical demands as events progress through multiple stages or locations, and data from heart rate monitors combined with GPS tracking shows how competitors modify pacing strategies when moving between indoor arenas and outdoor fields or from sea-level venues to high-altitude sites. Studies compiled by the Australian Institute of Sport demonstrate that endurance athletes often reduce initial output by 3 to 5 percent in the first round at altitude before regaining baseline efficiency in later stages through acclimatization responses visible in oxygen uptake measurements.
Researchers have observed these shifts in events spanning several days or weeks where each round presents unique environmental factors, and patterns emerge when analysts compare split times or stroke rates across sessions. Those who study longitudinal performance records note that power output data frequently stabilizes after the second or third exposure to a particular venue element, indicating physiological adjustments that data algorithms can flag with increasing accuracy.
Data Collection Methods and Pattern Identification
Performance tracking systems gather variables including stride frequency, ball velocity in racket sports, and swim stroke efficiency, then apply statistical models to isolate venue-specific influences from individual skill levels. When analysts cross-reference these figures against weather logs and surface hardness readings, they identify clusters where athletes exhibit measurable changes in technique or energy distribution. One dataset from multi-stage cycling events revealed that riders increased cadence by an average of 4 revolutions per minute when transitioning from flat stages to mountain finishes, a pattern repeated across several Tours and confirmed through repeated measurements.
Software platforms now integrate real-time feeds from wearable devices with historical venue profiles, allowing observers to spot early signs of adaptation such as reduced ground contact time on new surfaces or altered breathing rhythms in humid conditions. These tools process thousands of data points per athlete per round, generating visualizations that highlight deviations from expected norms based on prior performances at similar sites.
Examples from Recent Multi-Round Events
Take the case of swimmers at world championship meets where preliminary heats occur in one pool configuration and finals shift to another setup with different lane rope tensions and water temperatures. Performance records indicate that times in backstroke events often improve by fractions of a second in later rounds as competitors adjust body position to new wave patterns, a trend documented in meet archives spanning multiple championships. Similarly, in tennis tournaments played across hard courts then grass surfaces within a compressed schedule, serve speed data shows initial drops followed by recovery as players recalibrate footwork and racket angles.
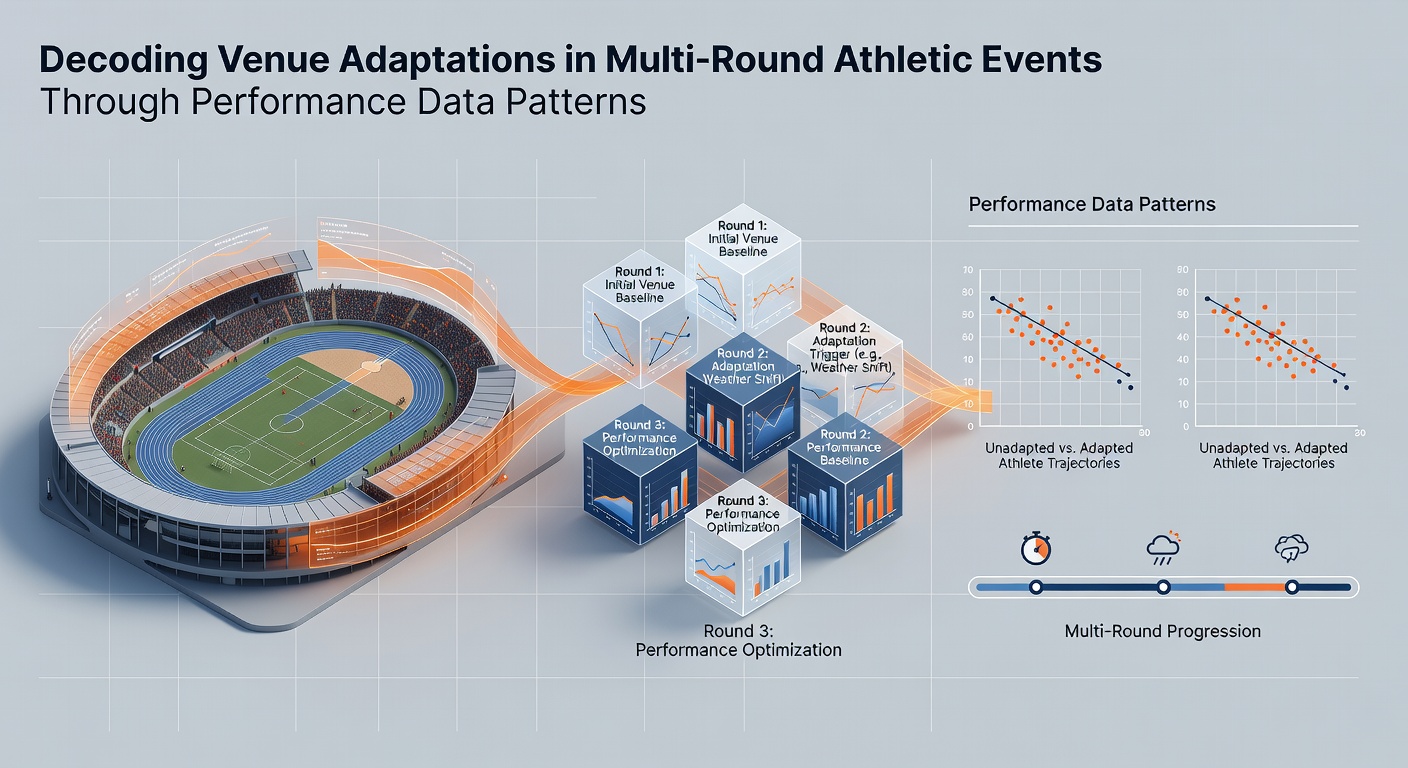
Track athletes competing in combined events like the decathlon provide another clear illustration, since they move between throwing circles, jumping pits, and running tracks within the same meet. Analysts reviewing force plate readings find that horizontal jump distances tend to increase after the first day once athletes account for runway textures and wind patterns at that specific stadium. Such adjustments appear consistently when data from different years and locations undergoes comparative review.
Role of Technology in Revealing Adaptations
Advanced analytics platforms process venue data alongside biometric streams to forecast how individuals or teams might respond in upcoming rounds, and organizations including the Canadian Olympic Committee have incorporated these insights into preparation protocols for upcoming cycles leading into 2026 competitions. Machine learning models trained on past tournaments detect subtle correlations, such as links between crowd noise levels and false start frequencies in sprint events, that human observers might overlook during live competition.
Coaches receive dashboards displaying these patterns in simplified formats, enabling targeted interventions like modified warm-up routines or equipment tweaks between rounds. Data from the 2024 Paris Olympics and subsequent qualifiers already shows measurable improvements in adaptation speed when athletes review their own historical metrics from comparable venues beforehand.
Challenges in Interpreting Performance Patterns
Although data sets grow larger each season, variables such as injury history, travel fatigue, and psychological factors complicate direct attribution of changes solely to venue elements. Researchers address this by applying regression analyses that control for multiple influences simultaneously, yet gaps remain when events occur at unique sites without prior comparable data. International federations continue to standardize measurement protocols across disciplines to improve cross-event comparability and reduce interpretation errors.
What's significant is how these analytical approaches continue evolving with new sensor technologies that capture previously inaccessible details like muscle activation sequences during venue transitions. As events approach the 2026 calendar, accumulated datasets from prior cycles provide richer baselines for identifying adaptation thresholds earlier in competition schedules.
Conclusion
Performance data patterns offer concrete evidence of how athletes navigate venue changes throughout multi-round athletic events, with metrics from diverse competitions illustrating repeatable adjustment processes across surfaces, climates, and altitudes. Continued refinement of collection methods and analytical frameworks supports more precise identification of these adaptations, benefiting preparation strategies for future cycles including those scheduled around 2026.