Performance Data Overlaps Between Football Series and Equine Racing Circuits
Clara Werner · May 27, 2026
Performance Data Overlaps Between Football Series and Equine Racing Circuits
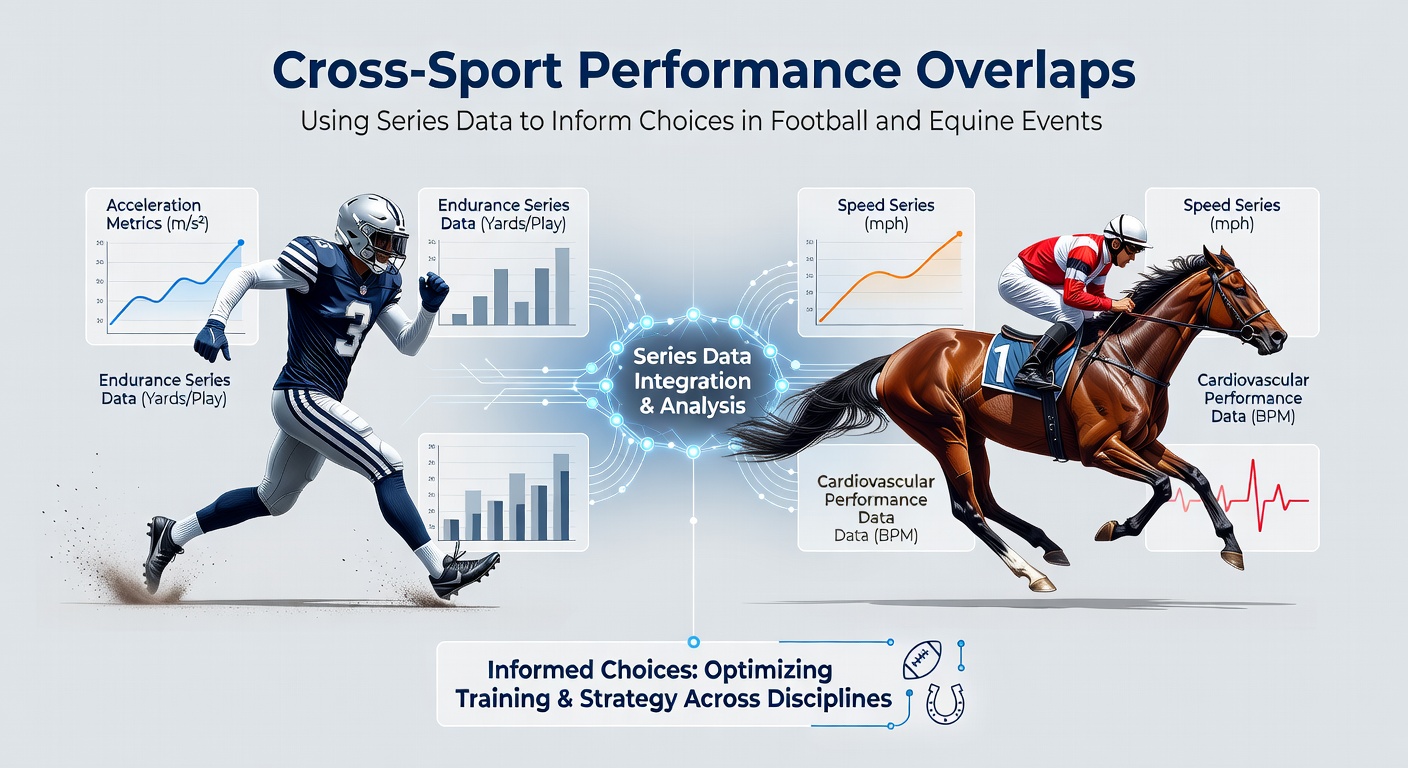
Football series and equine racing circuits generate extensive performance records that analysts examine for recurring patterns across both disciplines, and these datasets often reveal shared elements in endurance, recovery intervals, and response to competitive pressure. Observers note that structured series formats in each sport create comparable timelines for tracking form fluctuations, which allows for direct comparisons when researchers align match sequences with race schedules. Data from major leagues and racing meets shows how players and horses demonstrate similar peaks during consecutive high-stakes events, while fatigue markers appear at predictable intervals following intense periods of activity.
Core Metrics Collected in Football Series
Teams record distance covered, sprint frequency, and heart-rate variability throughout multi-week campaigns, and these figures accumulate into profiles that highlight consistency under varying match loads. League authorities compile such statistics across entire seasons, which provides baseline comparisons when clubs face fixture congestion or travel demands. Researchers have examined how defensive units maintain positioning accuracy even after multiple consecutive games, whereas attacking players show measurable drops in acceleration during later stages of dense schedules.
Equine Data Points from Racing Circuits
Trainers and governing bodies track stride length, sectional times, and post-race recovery blood markers across successive starts, and these measurements form longitudinal records that mirror the type of series tracking used in team sports. International bodies such as the International Federation of Horseracing Authorities publish aggregated results from graded races worldwide, which enables pattern identification in stamina retention and surface adaptation. Studies indicate that horses competing in back-to-back events on similar ground conditions often display repeatable speed retention curves that parallel the workload tolerance seen in football squads.
Shared Patterns Across the Two Sports
Analysts align recovery windows between football matches and equine starts to identify overlap zones where performance stability holds steady, and such alignments frequently surface in both May 2026 European league run-ins and concurrent Southern Hemisphere racing carnivals. Evidence suggests that athletes and equines subjected to comparable cumulative stress exhibit parallel declines in peak output after three or four high-intensity outings within a fortnight. Those who study these datasets observe that terrain changes, whether pitch conditions or track surfaces, produce consistent shifts in stride efficiency and ball-retention rates respectively.
Practical Uses of Cross-Referenced Series Information
Coaches and trainers review combined datasets when planning rotation policies or entry selections, and they apply thresholds derived from one sport to forecast outcomes in the other. For instance, a football side preparing for a midweek cup tie alongside weekend league fixtures can reference equine recovery curves from Australian racing authorities to calibrate rest protocols. Similarly, racing stables preparing horses for spring carnival campaigns draw on European football load-management models to time workouts and travel. Data from university-led performance labs further supports these cross-applications by demonstrating how cardiovascular and musculoskeletal markers follow comparable trajectories under repeated loading.

Canadian Sport Institute reports on elite athlete monitoring further illustrate how multi-sport data frameworks help identify early signs of overtraining, and these same frameworks translate directly when applied to equine monitoring programs. The resulting insights allow decision-makers to adjust preparation timelines based on historical overlap rather than isolated observations from a single discipline.
Limitations and Data Considerations
Variability in data collection methods across different leagues and racing jurisdictions introduces noise into cross-sport comparisons, and analysts must normalize variables such as measurement frequency and environmental factors before drawing conclusions. Regulatory frameworks from bodies like the Australian Sports Commission emphasize standardized reporting to reduce discrepancies, yet gaps remain when series data from lower-tier competitions enters the analysis. Researchers continue refining algorithms that account for these inconsistencies while preserving the core overlap signals that prove most reliable.
Conclusion
Series data from football and equine events continues to supply overlapping performance indicators that inform preparation and selection processes across both fields, and the growing integration of these datasets supports more precise workload management. As competitions evolve through 2026 and beyond, the alignment of recovery patterns, stress responses, and consistency metrics offers a factual foundation for decisions grounded in measurable trends rather than isolated intuition.