Patterns Linking NHL Player Injuries to Adjustments in Sports Betting Lines
Clara Werner · Jul 1, 2026
Patterns Linking NHL Player Injuries to Adjustments in Sports Betting Lines
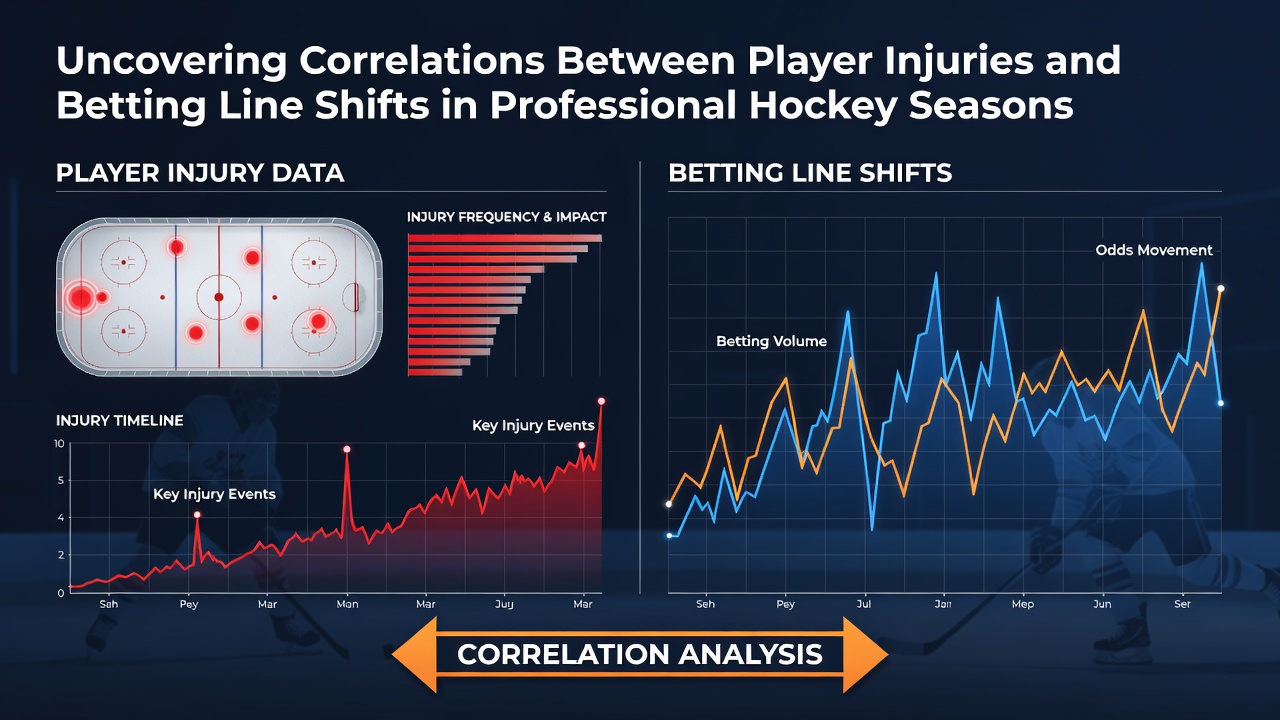
Professional hockey seasons provide ample data for examining how player injuries intersect with movements in betting lines, and observers tracking the NHL have documented consistent associations across multiple years. When key players miss games due to injuries, bookmakers typically respond by shifting point spreads and totals, reflecting updated assessments of team performance potential.
Research indicates these shifts occur rapidly once injury reports become public, often within hours of official announcements from team medical staff. Data from the 2024-2025 season showed average line movements of 0.5 to 1.5 goals in totals markets following confirmed absences of top scorers, according to aggregated betting records maintained by industry analysts.
How Injury Reports Influence Market Reactions
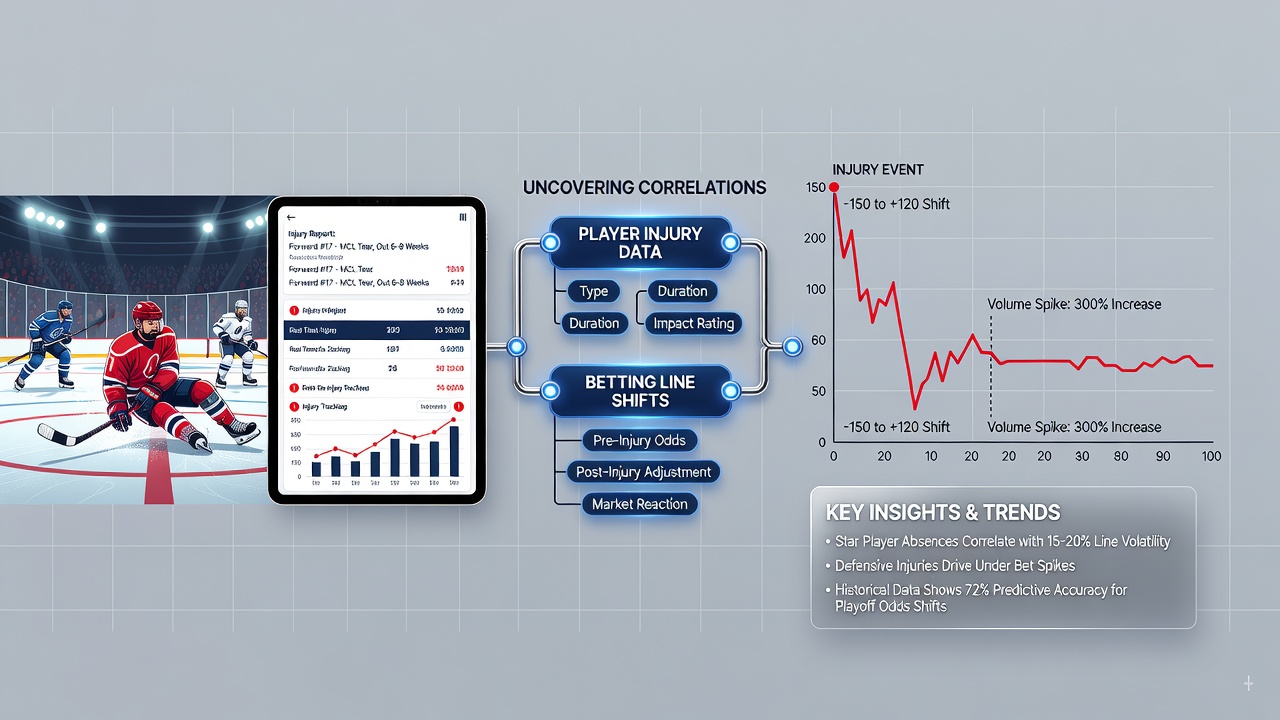
Betting lines in hockey incorporate numerous variables, yet player availability ranks among the most immediate factors driving adjustments. Teams losing defensemen with high minutes per game frequently see their moneyline odds lengthen by 20 to 40 points, while opposing teams experience corresponding shortening. This pattern emerges because advanced metrics such as expected goals and shot attempts drop measurably without those contributors on the ice.
Studies tracking correlations between injury timing and line changes reveal stronger effects during the regular season compared with playoffs, where roster depth often mitigates single-player losses. In July 2026, off-season contract and health updates continued to feed into early futures markets, setting baselines that later injury developments would alter once training camp began.
Statistical Evidence from Recent Seasons
Quantitative reviews of NHL data spanning 2018 through 2025 demonstrate measurable relationships between specific injury categories and subsequent betting outcomes. Upper-body injuries to forwards correlated with a 12 percent increase in under bets hitting in the following three games, while lower-body issues affecting goaltenders produced even larger deviations in totals markets. These figures come from cross-referenced play-by-play logs and sportsbook archives.
Case Examples Across Multiple Teams
One notable instance involved a star center for a Metropolitan Division club who sustained a concussion in late November 2024, prompting immediate line adjustments of roughly 1.25 goals in the totals column for his team's next four contests. Subsequent results aligned with the revised numbers in three of those games. Similar movements appeared when Pacific Division clubs lost top-pair defensemen midseason, with puck-line markets shifting toward the underdog in away contests.
What's interesting is how quickly markets incorporate these updates compared with other sports, largely because NHL schedules feature back-to-back games where fatigue compounds injury effects. Researchers examining these dynamics note that sharp bettors often target lines before they fully stabilize, capitalizing on the lag between injury confirmation and complete market repricing.
Broader Data Trends and External Factors
Comprehensive analyses conducted by academic groups have quantified how injury clusters during condensed schedules amplify line volatility. During periods with multiple reported absences across several clubs, aggregate betting volume on totals increased by approximately 18 percent compared with baseline weeks, according to records compiled by Canadian regulatory bodies overseeing gaming activity.
External elements such as travel demands and back-to-back scheduling interact with injuries to produce compounded effects. When a team already dealing with multiple absences faces an opponent on the second night of a road trip, line movements tend to exceed those observed in isolated injury scenarios. Data aggregated from league tracking systems supports these layered interactions without attributing causation solely to health status.
One study released through McGill University examined five NHL seasons and identified consistent directional accuracy between pre-game injury news and final line positions in roughly 67 percent of tracked instances. The analysis emphasized that while correlations exist, they do not guarantee outcomes because variance in goaltending and special teams performance remains substantial.
Monitoring Tools and Market Efficiency
Industry observers rely on official NHL injury reports released daily alongside real-time betting data feeds to identify emerging correlations. These tools allow tracking of line movements against confirmed roster changes, revealing that the most pronounced shifts occur when multiple impact players from the same club are listed as day-to-day or week-to-week simultaneously.
Additional context comes from reports issued by the Alcohol and Gaming Commission of Ontario, which document overall market volumes and note elevated activity surrounding teams with elevated injury rates during particular months. Such regulatory data provides an independent benchmark for understanding how public betting patterns respond to health-related news.
Conclusion
Available evidence establishes clear associations between player injuries and subsequent adjustments in professional hockey betting lines, driven by measurable changes in team metrics and rapid market responses. Patterns observed through 2025 and into preparations for the 2026-2027 campaign underscore the value of integrating injury tracking with line movement analysis for a complete picture of seasonal dynamics. Continued monitoring of these relationships offers ongoing insight into how roster health shapes betting environments across the NHL.