Fixture Fatigue: How Back-to-Back Games Shape Draw Rates in League Play
Clara Hughes · Aug 26, 2026
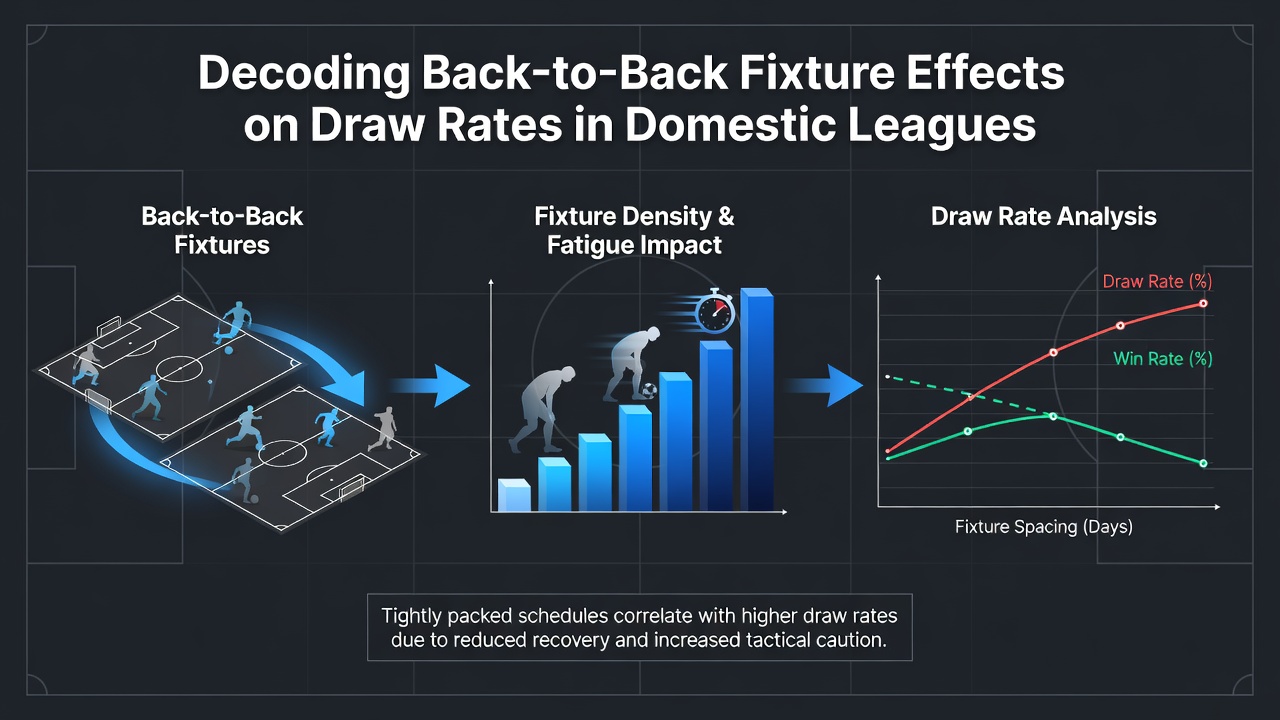
Fixture Fatigue: How Back-to-Back Games Shape Draw Rates in League Play
Domestic leagues around the world schedule matches in ways that sometimes force clubs into back-to-back fixtures, and analysts track how these situations influence match outcomes. Data collected from top-flight competitions shows measurable shifts in draw percentages when teams play with limited recovery time between games, and the patterns hold across several seasons. Researchers compile results from leagues in Europe, South America, and Asia to compare rest intervals and final scores, while statisticians adjust for variables such as travel distance and squad rotation depth.
Scheduling Pressures Across Major Leagues
League calendars expand because of cup competitions, international breaks, and television demands, so clubs often face two matches within a 72-hour window. The English Premier League, La Liga, Serie A, and Bundesliga each publish fixture lists that reveal clusters of midweek and weekend games, and similar congestion appears in Brazil's Série A and Japan's J-League during summer months. August 2026 opens another season where several clubs already face three games in eight days because of European qualifiers that spill into domestic rounds, and fixture planners continue to balance broadcast revenue against player welfare guidelines issued by confederations.
Rest Intervals and Performance Metrics
Performance analysts measure total distance covered, high-intensity sprints, and pass completion rates when teams return to action after short rests. Figures compiled by Opta and similar providers indicate that teams playing again within three days record lower sprint counts and slightly higher pass accuracy in the first half, yet these metrics shift toward parity in the second half. Draw rates rise modestly in such fixtures because both sides adopt more cautious approaches once fatigue sets in, and the same trend appears when both teams in a matchup arrive with comparable rest deficits. Observers note that the effect strengthens in leagues where squad depth remains limited, whereas clubs with larger rotations show smaller changes in outcome distribution.
Regional Variations in Draw Frequency
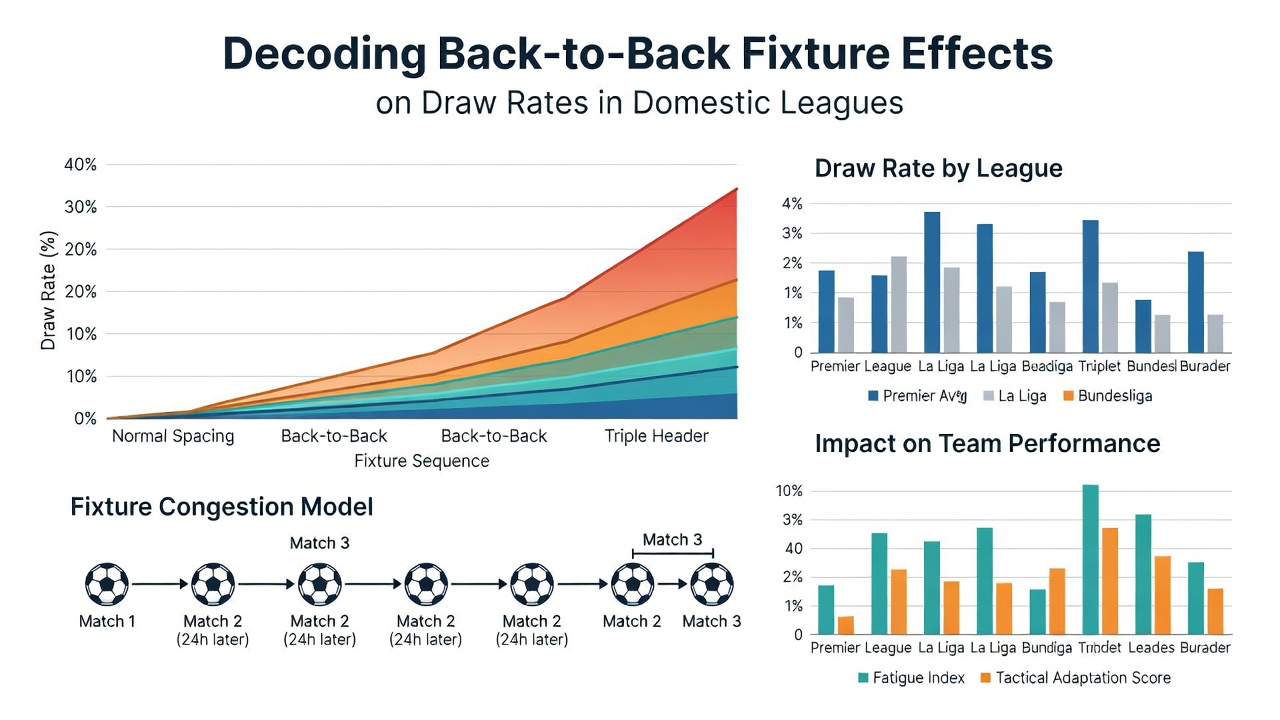
Studies covering the 2022-2025 seasons across five major European leagues report that back-to-back fixtures produce draw percentages between 28 and 34 percent, compared with an overall league average near 30 percent. In contrast, data from the Brazilian Série A during the same period shows a slightly larger increase, reaching 36 percent in congested periods. Australian A-League records display comparable movement when teams travel across time zones for consecutive rounds, and the Canadian Premier League publishes similar internal reports that highlight rest as a factor in match results. These regional differences trace back to travel requirements, climate conditions, and the number of available substitutes on any given matchday.
Statistical Models and Control Variables
Regression analyses published by academic groups at universities in Germany and Australia incorporate factors such as home advantage, recent form, and injury counts to isolate the rest-interval variable. The models consistently flag a small but repeatable uptick in draws when both teams have less than four days between matches, and the coefficient remains stable after controlling for weather and pitch conditions. European Club Association reports from 2024 and 2025 reinforce these findings by publishing aggregated squad rotation data that shows managers adjust lineups more conservatively during congested spells. Those adjustments correlate with fewer goals and a higher share of stalemates, although the magnitude varies by competition.
Case Examples from Recent Seasons
One Bundesliga side during the 2024-25 campaign played four matches in 12 days and recorded three draws, while its opponents in those fixtures also arrived with reduced recovery windows. In Brazil's Série A the following winter, a mid-table club navigated a run of five games across 15 days and finished with two wins and three draws, numbers that aligned with league-wide trends for similarly congested schedules. Observers tracking the J-League in 2025 noted that teams returning from international breaks without full preparation posted draw rates above their season averages, and the pattern repeated when domestic cups created extra midweek fixtures. Such examples illustrate how fixture density intersects with other variables rather than acting in isolation.
Implications for League Planning
League organizers review these statistics when they construct future calendars, and they weigh calls from player unions for minimum rest mandates against commercial pressures. Confederations publish guidelines that recommend at least four days between domestic matches, yet enforcement differs by territory. Data from the 2025-26 season, which began in August 2026, already shows early clusters that test these recommendations, and governing bodies continue to monitor outcome distributions for any sustained deviation. Clubs adapt by expanding medical and sports-science staff, while analysts refine predictive models that feed into both performance planning and broadcast scheduling decisions.
Conclusion
Back-to-back fixtures produce measurable, though modest, changes in draw rates across domestic leagues, and the effect appears consistently once researchers control for multiple external factors. Patterns hold across continents and competition formats, while variations in magnitude trace to travel, squad depth, and scheduling density. Ongoing data collection from the 2026 season onward will allow further refinement of these observations as calendars continue to evolve.