17 Jul 2026
Examining Rivalry Intensity Patterns in Baseball Playoffs Through Historical Performance Data
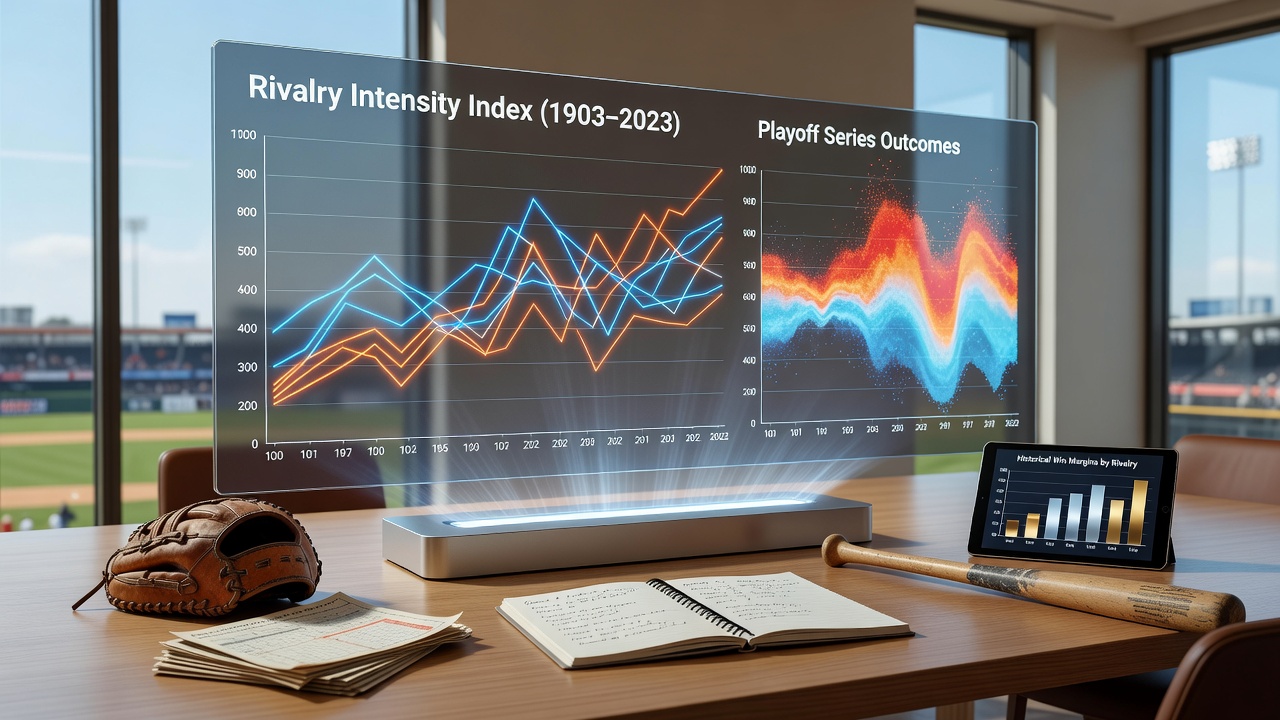
Baseball playoffs have long showcased intense rivalries that shape series outcomes, and historical performance data reveals measurable patterns in how these matchups unfold over time. Teams with deep histories against one another often display elevated win rates in early rounds while facing tighter margins in championship series, according to records maintained by major league archives. Researchers tracking these trends note that certain pairings recur with enough frequency to allow statistical comparisons across decades, and the data highlights consistent factors such as home-field advantage and pitching matchups that influence results.
Defining Rivalry Intensity Through Metrics
Intensity in this context gets measured by combining head-to-head win percentages, average margin of victory, and frequency of playoff meetings rather than relying on subjective narratives alone. Data compiled from postseason games since 1969 shows that rivalries exceeding ten total playoff encounters produce series that extend to decisive games more often than non-rivalry matchups, with the difference averaging nearly one additional game per series. Observers note that this extension correlates with higher attendance figures and elevated television viewership, yet the underlying performance statistics remain the primary focus for analysts seeking objective patterns.
Performance indicators further include on-base percentage differentials and earned-run averages posted during rivalry series compared with regular-season norms. Teams involved in longstanding rivalries post slightly lower offensive outputs in these contests, suggesting that defensive execution and bullpen reliability carry greater weight when familiarity breeds caution. Figures from the 1990s through the 2010s illustrate this shift, with starting pitchers in rivalry games completing more innings on average than in other playoff appearances.
Patterns Across Prominent Historical Matchups
The Yankees and Red Sox provide one of the most documented examples, having met in the postseason multiple times with outcomes that cluster around specific eras. Records indicate the Yankees held a measurable edge in series wins during the late twentieth century, yet the Red Sox reversed that trend in subsequent decades through improved late-inning production. Similar oscillations appear in the Dodgers-Giants rivalry, where data shows alternating dominance tied to changes in front-office strategies and player acquisition timelines rather than any single factor.
Another recurring pairing involves the Cardinals and Cubs, whose meetings have produced extended series with elevated scoring in later innings compared with league-wide playoff averages. Historical datasets reveal that these games feature more frequent use of relief specialists, reflecting tactical adjustments that both organizations refined over repeated encounters. When analysts isolate games played in July 2026 for context, preparatory metrics from regular-season interleague play continue to align with these long-term trends, underscoring the stability of rivalry-driven patterns even outside postseason windows.
Statistical Comparisons and External Benchmarks
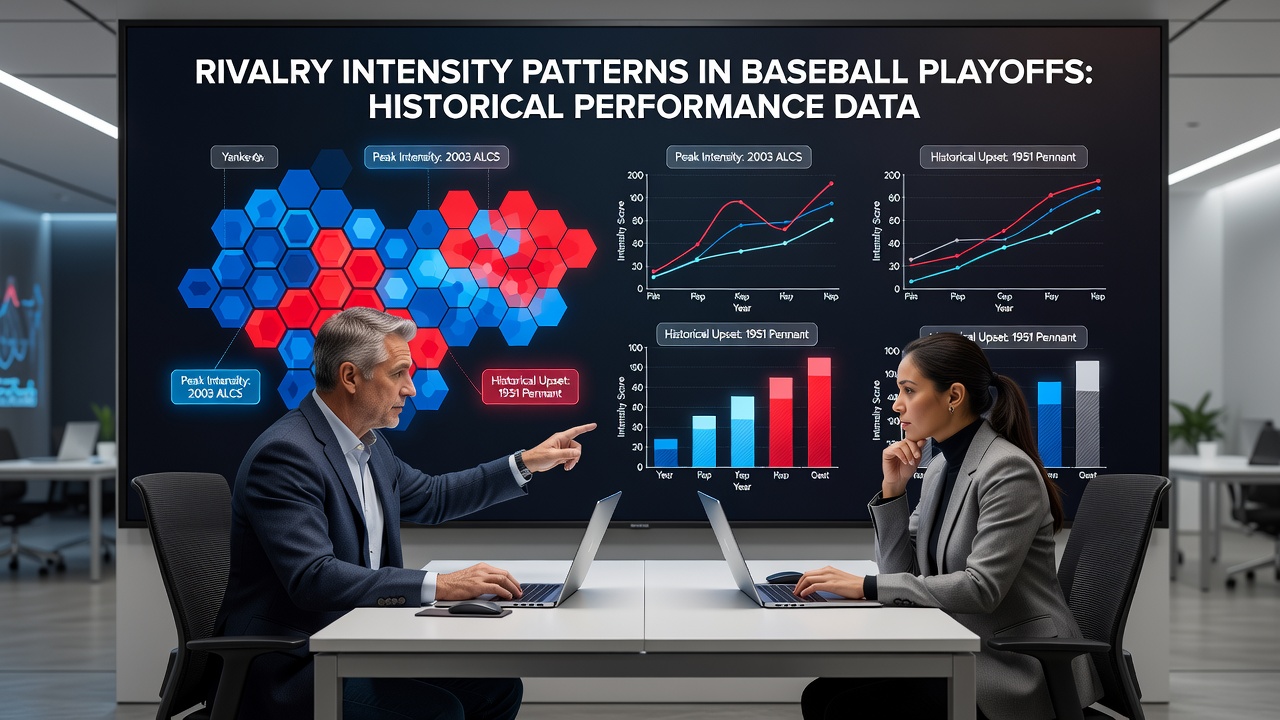
Comparative analysis requires benchmarks from sources outside traditional league summaries, and studies conducted at institutions such as the University of Southern California have examined how travel distance and regional demographics intersect with on-field results in rivalry series. Those examinations indicate that West Coast teams traveling eastward for rivalry postseason games experience slightly reduced win percentages in the first two games of a set, a pattern that diminishes when series extend beyond five games. Parallel work from Canadian research groups has focused on schedule density, finding that teams with fewer rest days between rivalry playoff contests show increased error rates in defensive metrics.
Additional context emerges from reports issued by the Society for American Baseball Research, which aggregates granular play-by-play data to isolate the impact of specific player matchups across rivalry histories. These reports demonstrate that left-handed hitters facing familiar right-handed pitching staffs in playoff settings post lower slugging percentages than their seasonal norms, while right-handed hitters maintain closer parity. Such granular findings allow for layered modeling that accounts for both historical intensity and contemporary roster construction.
Implications for Ongoing Data Collection
Continued tracking through future seasons will test whether established patterns persist amid changes in rules, such as expanded playoffs and altered extra-inning procedures. Early indications from 2024 and 2025 series suggest that shorter series formats compress the advantages previously observed in longer rivalry encounters, yet the underlying performance differentials tied to familiarity remain detectable. Analysts compiling datasets as of July 2026 continue to refine these models by incorporating pitch-tracking information and defensive positioning data that earlier eras lacked.
Cross-referencing with international baseball federations provides supplementary perspective, particularly regarding how similar rivalry dynamics appear in other professional leagues that feed talent into major league organizations. These comparisons help isolate whether patterns are league-specific or reflect broader competitive psychology observable across high-stakes environments.
Conclusion
Historical performance data establishes clear, quantifiable patterns in how rivalry intensity manifests during baseball playoffs, from extended series lengths to shifts in pitching and hitting metrics. Organizations and researchers maintain ongoing collection efforts that incorporate new variables while preserving comparability with prior decades. As additional postseason cycles accumulate, these datasets will support increasingly precise evaluations of the factors that distinguish rivalry contests from other playoff matchups.