Decoding Bookmaker Margin Adjustments Through Seasonal Performance Data in Team Events and Track Competitions
Clara Hughes · Jun 19, 2026
Decoding Bookmaker Margin Adjustments Through Seasonal Performance Data in Team Events and Track Competitions
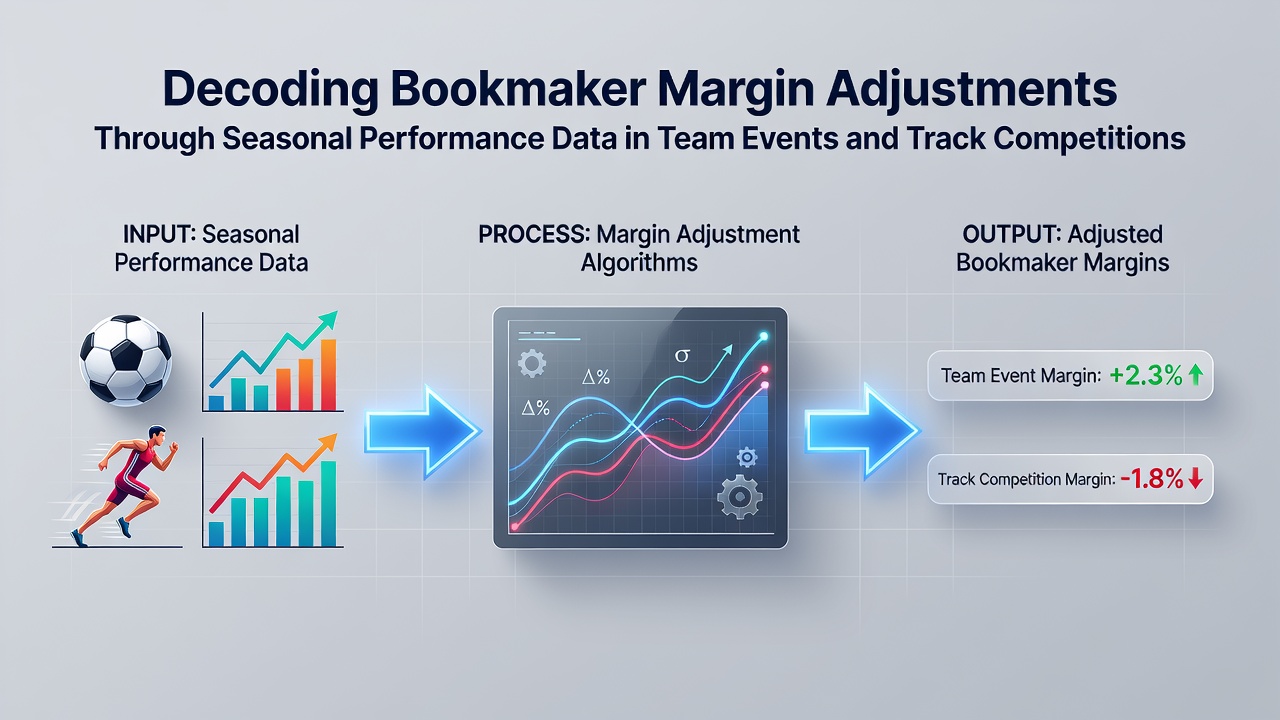
Bookmakers rely on complex algorithms that incorporate seasonal performance data when setting and adjusting margins across team events such as football leagues and basketball conferences alongside track competitions including sprints and distance races; these adjustments reflect shifts in team form or individual athlete consistency throughout a campaign. Data from multiple seasons demonstrates how early results feed into margin recalibrations that occur at regular intervals, often aligned with mid-season breaks or post-competition reviews.
Core Mechanics of Margin Calculation
Bookmaker margins represent the built-in advantage that ensures profitability regardless of outcome distribution, and operators refine these percentages by cross-referencing historical win rates against current seasonal metrics such as goal differentials in team sports or personal best timings in track events. Analysts process datasets that track home versus away splits, injury recovery patterns, and weather influences on outdoor tracks, then apply weighted models that elevate or reduce margins accordingly. Figures from European betting operators reveal typical margin ranges between 2 and 5 percent for major team fixtures while track events often sit between 3 and 7 percent depending on field depth.
Seasonal data enters these models through automated feeds that update daily, allowing real-time tweaks when a team records unexpected streaks or a sprinter posts consistent sub-record performances. Those who monitor these shifts note that margins tighten during high-stakes periods like playoff qualification rounds because volume increases while perceived uncertainty decreases.
Application in Team Events
Team competitions generate layered datasets because performance depends on collective dynamics rather than single variables; bookmakers therefore integrate metrics like points per game averages, defensive efficiency ratings, and head-to-head historical results when recalibrating margins. A mid-table side that improves its away record over successive months may see its implied probability margin compressed by several basis points as algorithms recognize reduced variance. Research published through the Australian Institute of Criminology on sports wagering patterns confirms that such adjustments occur most frequently after international breaks when fresh data streams become available.
League structures amplify these effects because cumulative standings influence future fixture margins; observers tracking the 2025-2026 campaigns observed tighter margins on matches involving clubs with strong second-half records compared to those showing fatigue indicators. The process remains iterative, with each round of results prompting fresh evaluations that feed back into pricing engines.
Adjustments in Track Competitions
Track events present different data challenges because individual athlete metrics dominate and external factors such as lane assignments or wind readings introduce variability that seasonal aggregates must capture. Bookmakers compile performance curves across indoor and outdoor seasons, then adjust margins when an athlete demonstrates repeatable excellence in specific event distances or surfaces. Data collected through June 2026 shows margins on elite 100-meter fields narrowing when multiple competitors post sub-10-second times within the same calendar window.
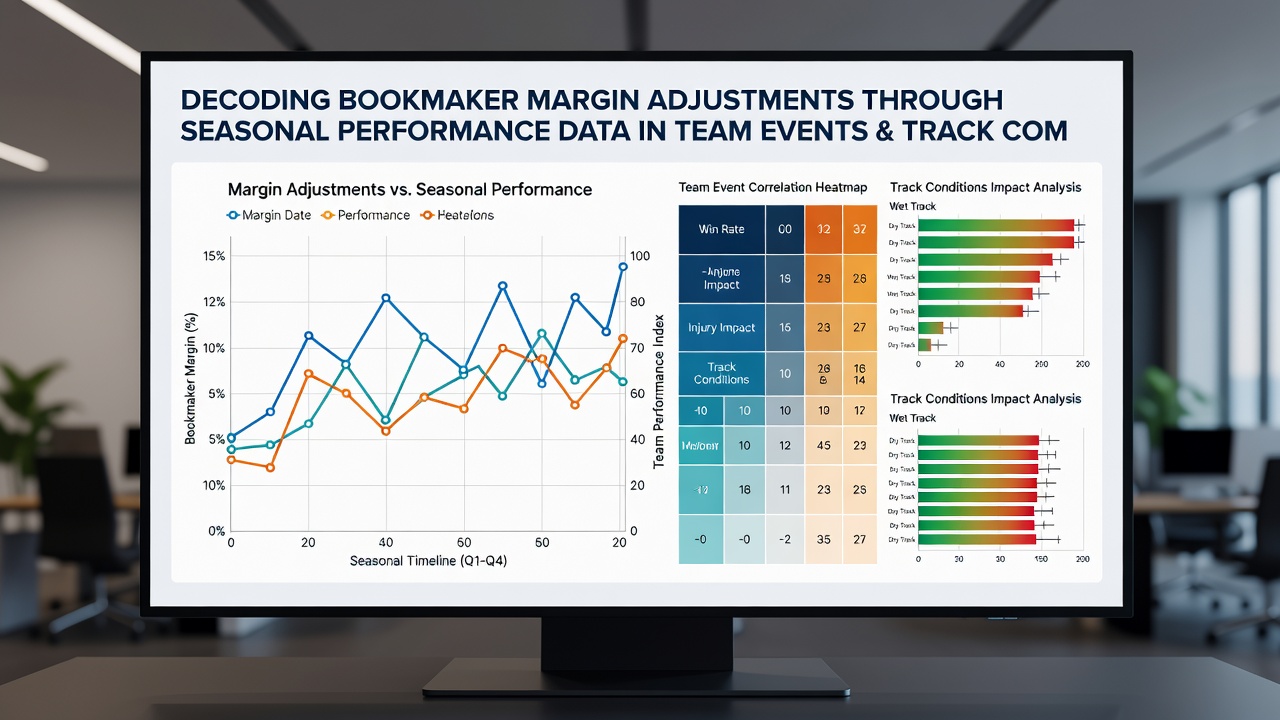
Relay teams add another dimension since baton exchange success rates and anchor leg timings contribute to composite seasonal profiles; operators respond by widening margins on events with frequent disqualifications or false starts recorded in prior meets. Those who study these patterns find that margins stabilize once sufficient races establish reliable form lines, yet sudden improvements in training data can trigger rapid recalibrations before major championships.
Data Integration and Model Refinement
Modern pricing systems combine public league tables with proprietary tracking tools that log training loads, recovery metrics, and travel schedules; this blended input allows margins to respond to subtle performance drifts before they appear in final results. Studies conducted at institutions such as the University of Queensland highlight how machine learning layers improve prediction accuracy by weighting recent matches more heavily than older ones within a single season. The outcome appears in narrower spreads on contests where both sides display consistent seasonal trajectories.
Regional differences also emerge because North American operators emphasize conference strength ratings while European platforms prioritize goal expectancy models derived from domestic cup runs. These variations produce distinct margin profiles that evolve as seasons progress and new performance clusters form.
Conclusion
Seasonal performance data serves as the primary driver behind bookmaker margin adjustments in both team and track competitions, producing dynamic pricing that reflects evolving competitive realities across multiple disciplines. Continued refinement of analytical models ensures these adjustments remain responsive to the latest available statistics while maintaining operational viability for operators worldwide.