Atmospheric Variables Reshaping Predictive Algorithms for Outdoor Venue Wagering
Ulrich Hayes · Jul 10, 2026
Atmospheric Variables Reshaping Predictive Algorithms for Outdoor Venue Wagering
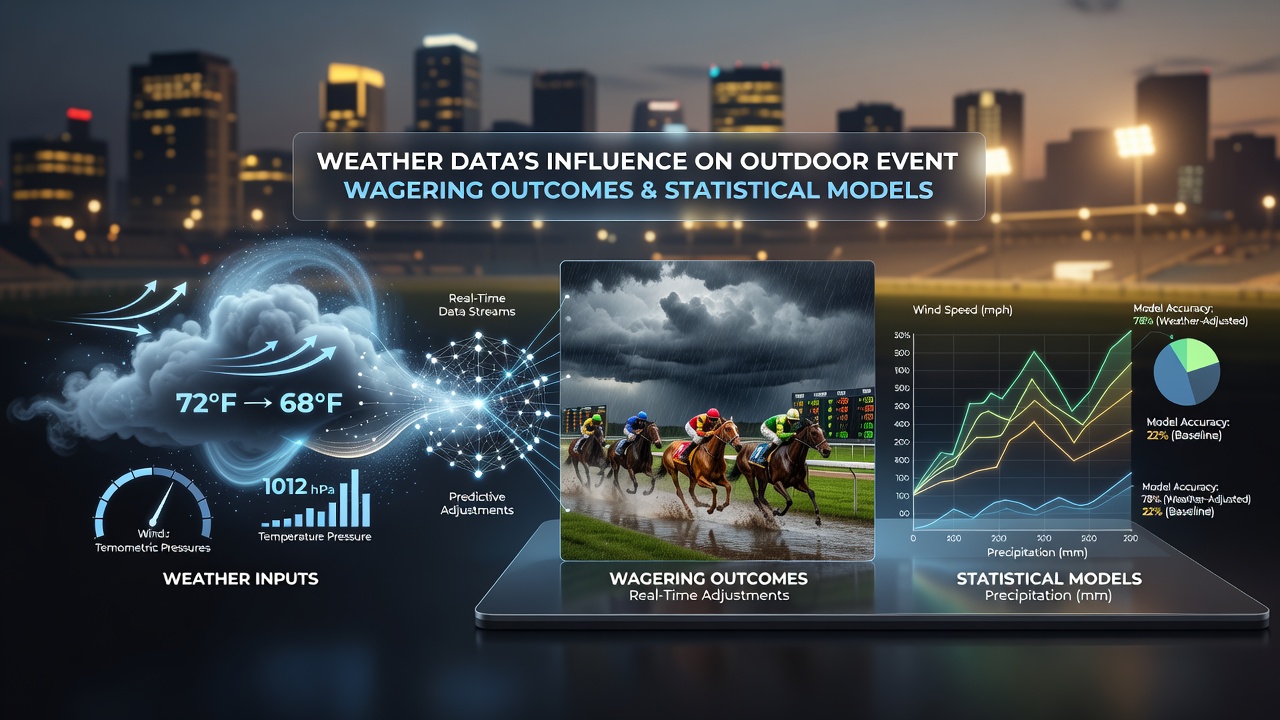
Weather conditions exert measurable effects on performance metrics across multiple outdoor sports and events, prompting analysts to incorporate meteorological inputs directly into statistical frameworks that generate wagering probabilities. Temperature shifts, wind speeds, humidity levels, and precipitation patterns alter player endurance, equipment behavior, and surface conditions in ways that historical performance data alone cannot capture, so modelers now blend real-time atmospheric readings with traditional statistics to refine outcome forecasts.
Core Weather Inputs and Their Direct Effects on Event Dynamics
High temperatures above 30 degrees Celsius reduce aerobic capacity during prolonged matches such as tennis grand slams or marathon stages in cycling, while wind gusts exceeding 25 kilometers per hour influence ball trajectory in golf and baseball, shifting expected scoring distributions. Precipitation changes court friction coefficients in tennis and field moisture in soccer, which in turn affects pass completion rates and goal probabilities according to datasets maintained by the National Oceanic and Atmospheric Administration.
Researchers have documented these relationships through longitudinal studies that correlate archived weather observations with play-by-play logs, revealing consistent patterns such as a 12 percent drop in serve percentages during high-humidity conditions at certain venues. Models therefore assign weighted coefficients to variables like dew point and barometric pressure when recalibrating expected values for individual player or team outputs.
Integration of Meteorological Data into Statistical Models
Modern wagering algorithms combine ensemble forecasting from sources including the European Centre for Medium-Range Weather Forecasts with machine-learning layers that process both historical match results and concurrent atmospheric readings. Gradient-boosted trees and neural networks ingest variables such as wind vector components and solar radiation indices at hourly intervals, allowing the systems to generate updated probability distributions as event start times approach. This dynamic adjustment reduces variance between pre-event lines and in-play revisions during July 2026 tournaments where sudden thunderstorms altered multiple fixtures across European circuits.
One study published by academic teams at meteorological research institutes demonstrated that incorporating precipitation probability grids improved accuracy in predicting baseball run totals by 8 to 15 percent compared with baseline models relying solely on team statistics. The same frameworks now extend to horse racing and open-air motorsport events, where track surface temperature and crosswind data directly influence speed ratings and finishing-time projections.

Regional Variations and Venue-Specific Adjustments
Coastal stadiums experience greater wind variability than inland arenas, prompting modelers to apply location-specific scaling factors derived from long-term anemometer records. Desert venues introduce extreme diurnal temperature swings that affect hydration strategies and recovery intervals between sets or periods, factors now embedded in endurance sub-models. Observers note that Australian open-air events frequently require additional humidity and UV index layers because local climate patterns differ markedly from temperate European circuits.
These geographic nuances lead analysts to maintain separate parameter sets for each major venue cluster, updating coefficients seasonally as climate baselines shift. Data pipelines pull from national weather services across multiple continents to ensure consistent granularity, allowing unified platforms to recalibrate probabilities without introducing regional bias.
Practical Applications in Live Market Adjustments
During live events, operators feed incoming radar and satellite feeds into micro-adjustment engines that revise line movements every few minutes. Sudden rain cells detected over a golf course, for instance, trigger immediate recalculations of birdie probabilities on exposed holes, while lightning delays in baseball prompt suspension clauses that alter cash-out values. These automated responses rely on pre-trained relationships between weather thresholds and performance deltas established through years of paired datasets.
Industry reports from regulatory bodies in Canada and Australia highlight how such integrations have become standard practice among licensed operators seeking to maintain market integrity when external conditions deviate from seasonal norms. The approach also supports responsible wagering frameworks by surfacing condition-related risk alerts to participants.
Future Refinements and Data Ecosystem Growth
Advances in high-resolution nowcasting and edge-deployed sensors promise finer spatial resolution for micro-climate effects inside large stadiums, potentially allowing pitch-level humidity gradients to inform in-game strategy models. Continued collaboration between meteorological agencies and data-science teams is expanding the feature space available to statistical frameworks, incorporating variables such as lightning density and particulate levels that previously remained outside wagering calculations.
Conclusion
Atmospheric data streams have become integral components of the statistical architectures that underpin outdoor event wagering markets, delivering measurable improvements in forecast calibration across tennis, golf, baseball, and other open-air disciplines. Continued expansion of sensor networks and ensemble prediction systems ensures these influences remain embedded in real-time probability updates through 2026 and beyond, supporting transparent and data-driven market operations.